ADT 2009 Annual Report Download - page 256
Download and view the complete annual report
Please find page 256 of the 2009 ADT annual report below. You can navigate through the pages in the report by either clicking on the pages listed below, or by using the keyword search tool below to find specific information within the annual report.-
 1
1 -
2
-
3
-
4
-
5
-
6
-
7
-
8
-
9
-
10
-
11
-
12
-
13
-
14
-
15
-
16
-
17
-
18
-
19
-
20
-
21
-
22
-
23
-
24
-
25
-
26
-
27
-
28
-
29
-
30
-
31
-
32
-
33
-
34
-
35
-
36
-
37
-
38
-
39
-
40
-
41
-
42
-
43
-
44
-
45
-
46
-
47
-
48
-
49
-
50
-
51
-
52
-
53
-
54
-
55
-
56
-
57
-
58
-
59
-
60
-
61
-
62
-
63
-
64
-
65
-
66
-
67
-
68
-
69
-
70
-
71
-
72
-
73
-
74
-
75
-
76
-
77
-
78
-
79
-
80
-
81
-
82
-
83
-
84
-
85
-
86
-
87
-
88
-
89
-
90
-
91
-
92
-
93
-
94
-
95
-
96
-
97
-
98
-
99
-
100
-
101
-
102
-
103
-
104
-
105
-
106
-
107
-
108
-
109
-
110
-
111
-
112
-
113
-
114
-
115
-
116
-
117
-
118
-
119
-
120
-
121
-
122
-
123
-
124
-
125
-
126
-
127
-
128
-
129
-
130
-
131
-
132
-
133
-
134
-
135
-
136
-
137
-
138
-
139
-
140
-
141
-
142
-
143
-
144
-
145
-
146
-
147
-
148
-
149
-
150
-
151
-
152
-
153
-
154
-
155
-
156
-
157
-
158
-
159
-
160
-
161
-
162
-
163
-
164
-
165
-
166
-
167
-
168
-
169
-
170
-
171
-
172
-
173
-
174
-
175
-
176
-
177
-
178
-
179
-
180
-
181
-
182
-
183
-
184
-
185
-
186
-
187
-
188
-
189
-
190
-
191
-
192
-
193
-
194
-
195
-
196
-
197
-
198
-
199
-
200
-
201
-
202
-
203
-
204
-
205
-
206
-
207
-
208
-
209
-
210
-
211
-
212
-
213
-
214
-
215
-
216
-
217
-
218
-
219
-
220
-
221
-
222
-
223
-
224
-
225
-
226
-
227
-
228
-
229
-
230
-
231
-
232
-
233
-
234
-
235
-
236
-
237
-
238
-
239
-
240
-
241
-
242
-
243
-
244
-
245
-
 246
246 -
 247
247 -
 248
248 -
 249
249 -
 250
250 -
 251
251 -
 252
252 -
 253
253 -
 254
254 -
 255
255 -
 256
256 -
 257
257 -
 258
258 -
 259
259 -
 260
260 -
 261
261 -
 262
262 -
 263
263 -
 264
264 -
 265
265 -
 266
266 -
267
-
268
-
269
-
270
-
271
-
272
-
273
-
274
-
275
-
276
-
277
-
278
-
279
-
280
-
281
-
282
-
283
-
284
-
285
-
286
-
287
-
288
-
289
-
290
 |
 |

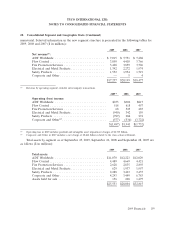
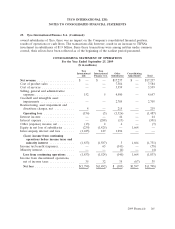
TYCO INTERNATIONAL LTD.
NOTES TO CONSOLIDATED FINANCIAL STATEMENTS
24. Summarized Quarterly Financial Data (Unaudited) (Continued)
2008
1st Qtr.(1) 2nd Qtr.(2) 3rd Qtr.(3) 4th Qtr.(4)
Net revenue .................................. $4,837 $4,863 $5,215 $5,284
Gross profit .................................. 1,680 1,678 1,851 1,867
Income from continuing operations ................. 360 272 199 264
Income from discontinued operations, net of income taxes . 3 8 277 170
Net income .................................. 363 280 476 434
Basic earnings per share:
Income from continuing operations ............... $ 0.73 $ 0.56 $ 0.41 $ 0.56
Income from discontinued operations, net of income
taxes ................................... 0.01 0.02 0.58 0.35
Net income ................................ 0.74 0.58 0.99 0.91
Diluted earnings per share:
Income from continuing operations ............... 0.72 0.56 0.41 0.55
Income from discontinued operations, net of income
taxes ................................... 0.01 0.01 0.57 0.36
Net income ................................ 0.73 0.57 0.98 0.91
(1) Net revenue excludes $425 million of revenue related to discontinued operations. Income from continuing operations
includes restructuring, asset impairment and divestiture charges net, of $14 million, and separation costs of $9 million.
(2) Net revenue excludes $418 million of revenue related to discontinued operations. Income from continuing operations
includes restructuring, asset impairment and divestiture charges, net of $42 million, and a legacy legal settlement charge of
$20 million slightly offset by a $5 million credit to separation costs.
(3) Net revenue excludes $264 million of revenue related to discontinued operations. Income from continuing operations
includes a class action settlement charge, net of $53 million and a legacy legal settlement charge of $9 million, offset by a
credit of $7 million for class action settlement recoveries.
(4) Net revenue excludes $114 million of revenue related to discontinued operations. Income from continuing operations
includes restructuring, asset impairment and divestiture charges, net of $139 million, goodwill impairment charges of
$9 million, an environmental remediation charge of $6 million related to the closure of a facility in North America, offset
by a credit of $3 million for class action settlement recoveries.
25. Tyco International Finance S.A.
TIFSA, a wholly-owned subsidiary of the Company, has public debt securities outstanding (see
Note 12) which are fully and unconditionally guaranteed by Tyco. TIFSA, which was formed in
December 2006, is a holding company established in connection with the Separation as the successor
company to TIGSA. During the third quarter of 2007, TIGSA’s assets and liabilities were contributed to
TIFSA, Covidien and Tyco Electronics. TIGSA was put into liquidation on June 1, 2007. TIFSA directly
and indirectly owns substantially all of the operating subsidiaries of the Company, performs treasury
operations and has assumed the indebtedness of TIGSA. The following tables present condensed
consolidating financial information for Tyco, TIFSA and all other subsidiaries. Condensed financial
information for Tyco and TIFSA on a stand-alone basis is presented using the equity method of
accounting for subsidiaries.
During the second quarter of 2008, the Company completed a tax-free restructuring involving the
transfer of certain investments from Tyco to TIFSA. Since the transactions were entirely among wholly-
164 2009 Financials