ADT 2009 Annual Report Download - page 133
Download and view the complete annual report
Please find page 133 of the 2009 ADT annual report below. You can navigate through the pages in the report by either clicking on the pages listed below, or by using the keyword search tool below to find specific information within the annual report.-
 1
1 -
2
-
3
-
4
-
5
-
6
-
7
-
8
-
9
-
10
-
11
-
12
-
13
-
14
-
15
-
16
-
17
-
18
-
19
-
20
-
21
-
22
-
23
-
24
-
25
-
26
-
27
-
28
-
29
-
30
-
31
-
32
-
33
-
34
-
35
-
36
-
37
-
38
-
39
-
40
-
41
-
42
-
43
-
44
-
45
-
46
-
47
-
48
-
49
-
50
-
51
-
52
-
53
-
54
-
55
-
56
-
57
-
58
-
59
-
60
-
61
-
62
-
63
-
64
-
65
-
66
-
67
-
68
-
69
-
70
-
71
-
72
-
73
-
74
-
75
-
76
-
77
-
78
-
79
-
80
-
81
-
82
-
83
-
84
-
85
-
86
-
87
-
88
-
89
-
90
-
91
-
92
-
93
-
94
-
95
-
96
-
97
-
98
-
99
-
100
-
101
-
102
-
103
-
104
-
105
-
106
-
107
-
108
-
109
-
110
-
111
-
112
-
113
-
114
-
115
-
116
-
117
-
118
-
119
-
120
-
121
-
122
-
 123
123 -
 124
124 -
 125
125 -
 126
126 -
 127
127 -
 128
128 -
 129
129 -
 130
130 -
 131
131 -
 132
132 -
 133
133 -
 134
134 -
 135
135 -
 136
136 -
 137
137 -
 138
138 -
 139
139 -
 140
140 -
 141
141 -
 142
142 -
 143
143 -
144
-
145
-
146
-
147
-
148
-
149
-
150
-
151
-
152
-
153
-
154
-
155
-
156
-
157
-
158
-
159
-
160
-
161
-
162
-
163
-
164
-
165
-
166
-
167
-
168
-
169
-
170
-
171
-
172
-
173
-
174
-
175
-
176
-
177
-
178
-
179
-
180
-
181
-
182
-
183
-
184
-
185
-
186
-
187
-
188
-
189
-
190
-
191
-
192
-
193
-
194
-
195
-
196
-
197
-
198
-
199
-
200
-
201
-
202
-
203
-
204
-
205
-
206
-
207
-
208
-
209
-
210
-
211
-
212
-
213
-
214
-
215
-
216
-
217
-
218
-
219
-
220
-
221
-
222
-
223
-
224
-
225
-
226
-
227
-
228
-
229
-
230
-
231
-
232
-
233
-
234
-
235
-
236
-
237
-
238
-
239
-
240
-
241
-
242
-
243
-
244
-
245
-
246
-
247
-
248
-
249
-
250
-
251
-
252
-
253
-
254
-
255
-
256
-
257
-
258
-
259
-
260
-
261
-
262
-
263
-
264
-
265
-
266
-
267
-
268
-
269
-
270
-
271
-
272
-
273
-
274
-
275
-
276
-
277
-
278
-
279
-
280
-
281
-
282
-
283
-
284
-
285
-
286
-
287
-
288
-
289
-
290
 |
 |

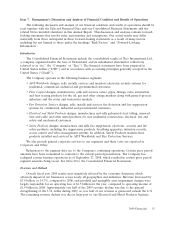
Flow Control
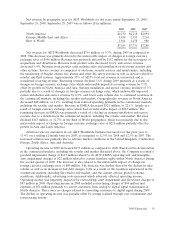
Net revenue, operating income and operating margin for Flow Control for the years ended
September 25, 2009, September 26, 2008 and September 28, 2007 were as follows ($ in millions):
2009 2008 2007
Revenue from product sales ............................. $3,580 $4,201 $3,618
Service revenue ...................................... 270 217 148
Net revenue ........................................ $3,850 $4,418 $3,766
Operating income .................................... $ 518 $ 618 $ 457
Operating margin ..................................... 13.5% 14.0% 12.1%
Net revenue for Flow Control decreased $568 million, or 12.9%, in 2009 as compared to 2008. The
decrease in net revenue was primarily driven by the unfavorable impact of changes in foreign currency
exchange rates of $462 million. Revenue also decreased due to reduced volume in the water business
and reduced project activity in the energy end market of the thermal controls business. The decrease in
revenue was partially offset by an increase in the valves business primarily from the energy end market
in EMEA. The net impact of acquisitions and divestitures unfavorably impacted net revenue by
$3 million in 2009 and favorably impacted net revenue by $16 million in 2008.
Operating income decreased $100 million, or 16.2%, in 2009 as compared to 2008. The decrease in
operating income was primarily due to the unfavorable impact of changes in foreign currency exchange
rates of $73 million as well as decreased volume in the water businesses discussed above offset by
margin improvements in the valves business. Margins were also negatively impacted by restructuring,
asset impairment and divestiture charges of $29 million. Additionally, management estimates that
$5 million of additional charges resulting from restructuring actions were incurred during 2009.
Restructuring, asset impairment and divestiture charges were $8 million in 2008. Additionally, selling,
general and administrative expenses in 2008 included an environmental remediation charge of
$6 million related to the closure of a facility in North America. The decline in operating income was
partially offset by savings realized through cost containment and restructuring actions.
Net revenue for Flow Control increased $652 million, or 17.3%, in 2008 as compared to 2007. The
increase in net revenue was largely driven by volume growth from continued strength in the valves and
thermal businesses, and to a lesser extent, the water business. The increase in the valves business was
primarily driven by project growth in the oil and gas industry while the thermal business benefited
primarily from strong project growth coupled with increased selling prices. While revenue within the
water business increased year-over-year, project activity declined during the second half of 2008,
primarily in Australia. Favorable changes in foreign currency exchange rates positively impacted
revenue by $314 million. The net impact of acquisitions, divestitures and other activity positively
affected revenue by $6 million.
Operating income increased $161 million, or 35.2%, in 2008 as compared to 2007 primarily from
revenue growth, as well as volume efficiencies. Flow Control incurred restructuring, asset impairment
and divestiture charges, net of $8 million, compared to $28 million in 2007. Additionally, selling,
general and administrative expenses in 2008 included an environmental remediation charge of
$6 million related to the closure of a facility in North America as compared to no charges in 2007.
2009 Financials 41