ADT 2009 Annual Report Download - page 194
Download and view the complete annual report
Please find page 194 of the 2009 ADT annual report below. You can navigate through the pages in the report by either clicking on the pages listed below, or by using the keyword search tool below to find specific information within the annual report.-
 1
1 -
2
-
3
-
4
-
5
-
6
-
7
-
8
-
9
-
10
-
11
-
12
-
13
-
14
-
15
-
16
-
17
-
18
-
19
-
20
-
21
-
22
-
23
-
24
-
25
-
26
-
27
-
28
-
29
-
30
-
31
-
32
-
33
-
34
-
35
-
36
-
37
-
38
-
39
-
40
-
41
-
42
-
43
-
44
-
45
-
46
-
47
-
48
-
49
-
50
-
51
-
52
-
53
-
54
-
55
-
56
-
57
-
58
-
59
-
60
-
61
-
62
-
63
-
64
-
65
-
66
-
67
-
68
-
69
-
70
-
71
-
72
-
73
-
74
-
75
-
76
-
77
-
78
-
79
-
80
-
81
-
82
-
83
-
84
-
85
-
86
-
87
-
88
-
89
-
90
-
91
-
92
-
93
-
94
-
95
-
96
-
97
-
98
-
99
-
100
-
101
-
102
-
103
-
104
-
105
-
106
-
107
-
108
-
109
-
110
-
111
-
112
-
113
-
114
-
115
-
116
-
117
-
118
-
119
-
120
-
121
-
122
-
123
-
124
-
125
-
126
-
127
-
128
-
129
-
130
-
131
-
132
-
133
-
134
-
135
-
136
-
137
-
138
-
139
-
140
-
141
-
142
-
143
-
144
-
145
-
146
-
147
-
148
-
149
-
150
-
151
-
152
-
153
-
154
-
155
-
156
-
157
-
158
-
159
-
160
-
161
-
162
-
163
-
164
-
165
-
166
-
167
-
168
-
169
-
170
-
171
-
172
-
173
-
174
-
175
-
176
-
177
-
178
-
179
-
180
-
181
-
182
-
183
-
 184
184 -
 185
185 -
 186
186 -
 187
187 -
 188
188 -
 189
189 -
 190
190 -
 191
191 -
 192
192 -
 193
193 -
 194
194 -
 195
195 -
 196
196 -
 197
197 -
 198
198 -
 199
199 -
 200
200 -
 201
201 -
 202
202 -
 203
203 -
 204
204 -
205
-
206
-
207
-
208
-
209
-
210
-
211
-
212
-
213
-
214
-
215
-
216
-
217
-
218
-
219
-
220
-
221
-
222
-
223
-
224
-
225
-
226
-
227
-
228
-
229
-
230
-
231
-
232
-
233
-
234
-
235
-
236
-
237
-
238
-
239
-
240
-
241
-
242
-
243
-
244
-
245
-
246
-
247
-
248
-
249
-
250
-
251
-
252
-
253
-
254
-
255
-
256
-
257
-
258
-
259
-
260
-
261
-
262
-
263
-
264
-
265
-
266
-
267
-
268
-
269
-
270
-
271
-
272
-
273
-
274
-
275
-
276
-
277
-
278
-
279
-
280
-
281
-
282
-
283
-
284
-
285
-
286
-
287
-
288
-
289
-
290
 |
 |

TYCO INTERNATIONAL LTD.
NOTES TO CONSOLIDATED FINANCIAL STATEMENTS
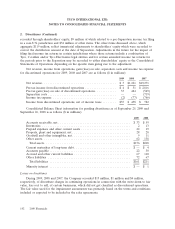
2. Divestitures (Continued)
recorded through shareholders’ equity, $9 million of which related to a pre-Separation income tax filing
in a non-U.S. jurisdiction and $34 million of other items. The other items discussed above, which
aggregate $119 million, reflect immaterial adjustments to shareholders’ equity which were recorded to
correct the distribution amount at the date of Separation. Adjustments in the future for the impact of
filing final income tax returns in certain jurisdictions where those returns include a combination of
Tyco, Covidien and/or Tyco Electronics legal entities and for certain amended income tax returns for
the periods prior to the Separation may be recorded to either shareholders’ equity or the Consolidated
Statements of Operations depending on the specific item giving rise to the adjustment.
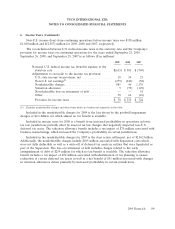
Net revenue, income from operations, gain (loss) on sale, separation costs and income tax expense
for discontinued operations for 2009, 2008 and 2007 are as follows ($ in millions):
2009 2008 2007
Net revenue .......................................... $ 3 $1,221 $19,271
Pre-tax income from discontinued operations .................. $ 4 $ 51 $ 2,816
Pre-tax gain (loss) on sale of discontinued operations ............ 33 484 (549)
Separation costs ....................................... — — (719)
Income tax expense .................................... (2) (77) (766)
Income from discontinued operations, net of income taxes ........ $35 $ 458 $ 782
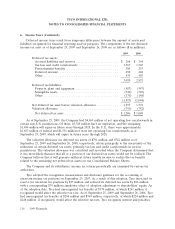
Consolidated Balance Sheet information for pending divestitures as of September 25, 2009 and
September 26, 2008 is as follows ($ in millions):
2009 2008
Accounts receivable, net ......................................... $ 33 $ 59
Inventories .................................................. 2 13
Prepaid expenses and other current assets ............................ 22 19
Property, plant and equipment, net ................................. 28 28
Goodwill and other intangibles, net ................................. 9 11
Other assets .................................................. 62 138
Total assets ................................................. $156 $268
Current maturities of long-term debt ................................ $ — $ 4
Accounts payable .............................................. 22 30
Accrued and other current liabilities ................................ 67 110
Other liabilities ............................................... 72 67
Total liabilities .............................................. $161 $211
Minority interest .............................................. $ — $ 1
Losses on divestitures
During 2009, 2008 and 2007, the Company recorded $15 million, $1 million and $4 million,
respectively, of divestiture charges in continuing operations in connection with the write-down to fair
value, less cost to sell, of certain businesses, which did not get classified as discontinued operations.
The fair value used for the impairment assessments was primarily based on the terms and conditions
included or expected to be included in the sales agreements.
102 2009 Financials