Vodafone 2016 Annual Report Download - page 99
Download and view the complete annual report
Please find page 99 of the 2016 Vodafone annual report below. You can navigate through the pages in the report by either clicking on the pages listed below, or by using the keyword search tool below to find specific information within the annual report.-
 1
1 -
2
-
3
-
4
-
5
-
6
-
7
-
8
-
9
-
10
-
11
-
12
-
13
-
14
-
15
-
16
-
17
-
18
-
19
-
20
-
21
-
22
-
23
-
24
-
25
-
26
-
27
-
28
-
29
-
30
-
31
-
32
-
33
-
34
-
35
-
36
-
37
-
38
-
39
-
40
-
41
-
42
-
43
-
44
-
45
-
46
-
47
-
48
-
49
-
50
-
51
-
52
-
53
-
54
-
55
-
56
-
57
-
58
-
59
-
60
-
61
-
62
-
63
-
64
-
65
-
66
-
67
-
68
-
69
-
70
-
71
-
72
-
73
-
74
-
75
-
76
-
77
-
78
-
79
-
80
-
81
-
82
-
83
-
84
-
85
-
86
-
87
-
88
-
 89
89 -
 90
90 -
 91
91 -
 92
92 -
 93
93 -
 94
94 -
 95
95 -
 96
96 -
 97
97 -
 98
98 -
 99
99 -
 100
100 -
 101
101 -
 102
102 -
 103
103 -
 104
104 -
 105
105 -
 106
106 -
 107
107 -
 108
108 -
 109
109 -
110
-
111
-
112
-
113
-
114
-
115
-
116
-
117
-
118
-
119
-
120
-
121
-
122
-
123
-
124
-
125
-
126
-
127
-
128
-
129
-
130
-
131
-
132
-
133
-
134
-
135
-
136
-
137
-
138
-
139
-
140
-
141
-
142
-
143
-
144
-
145
-
146
-
147
-
148
-
149
-
150
-
151
-
152
-
153
-
154
-
155
-
156
-
157
-
158
-
159
-
160
-
161
-
162
-
163
-
164
-
165
-
166
-
167
-
168
-
169
-
170
-
171
-
172
-
173
-
174
-
175
-
176
-
177
-
178
-
179
-
180
-
181
-
182
-
183
-
184
-
185
-
186
-
187
-
188
-
189
-
190
-
191
-
192
-
193
-
194
-
195
-
196
-
197
-
198
-
199
-
200
-
201
-
202
-
203
-
204
-
205
-
206
-
207
-
208
 |
 |

Overview Strategy review Performance Governance Financials Additional information
Vodafone Group Plc
Annual Report 2016
97
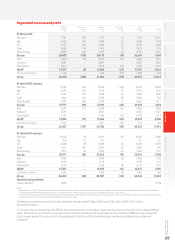
Segmental revenue and prot
Segment Intra-region Regional Inter-region Group
revenue revenue revenue revenue revenue EBITDA
£m £m £m £m £m £m
31 March 2016
Germany 7, 78 7 (26) 7, 761 (7) 7, 75 4 2,537
Italy 4,405 (15) 4,390 (1) 4,389 1,478
UK 6 ,173 (13) 6 ,16 0 (7) 6 ,153 1,289
Spain 3,633 (19) 3 ,614 (1) 3 ,613 915
Other Europe 4,835 (42) 4,793 (3) 4,790 1,467
Europe 26,833 (115) 26,718 (19) 26,699 7,686
India 4, 516 (9) 4,507 (14) 4,493 1,331
Vodacom13,887 – 3,887 – 3,887 1,484
Other AMAP 4,814 – 4, 814 (15) 4,799 1,227
AMAP 13, 217 (9) 13,208 (29) 13,179 4,042
Common Functions 1,16 0 – 1,16 0 (65) 1,095 (116)
Group 41,210 (124) 41,086 (113) 40,973 11, 612
31 March 2015 restated
Germany 8,384 (16) 8,368 (22) 8,346 2,659
Italy 4,587 (13) 4 ,574 (1) 4,573 1,535
UK 6 ,19 9 (13) 6 ,18 6 (2) 6 ,18 4 1,345
Spain 3 ,614 (18) 3,596 (2) 3,594 782
Other Europe 4,993 (30) 4,963 (1) 4,962 1,573
Europe 27,777 (90) 27,687 (28) 2 7,6 5 9 7, 8 94
India 4,309 (11) 4,298 (15) 4,283 1,282
Vodacom 4,341 – 4,341 – 4,341 1,527
Other AMAP 4 , 74 3 – 4, 74 3 (10) 4,733 1,277
AMAP 13,393 (11) 13,382 (25) 13,357 4,086
Common Functions 1,257 – 1,257 (46) 1,211 (65)
Group 42,427 (101) 42,326 (99) 42,227 11, 915
31 March 2014 restated
Germany 8,220 (9) 8,211 (11) 8,200 2,688
Italy 518 (1) 517 – 517 181
UK 6,248 (9) 6,239 (3) 6,236 1,398
Spain 3,471 (14) 3,457 (2) 3,455 786
Other Europe 5, 514 (9) 5,505 (3) 5,502 1,735
Europe 23,971 (42) 23,929 (19) 23,910 6,788
India 3,939 – 3,939 (3) 3,936 1,13 5
Vodacom 4,718 – 4,718 – 4,718 1,716
Other AMAP 4,730 – 4,730 (9) 4,721 1,279
AMAP 13,387 – 13,387 (12) 13,375 4 ,13 0
Common Functions 1,065 – 1,065 (4) 1, 061 166
Group 38,423 (42) 38,381 (35) 38,346 11,084
Discontinued operations
Verizon Wireless
2
9,955 4,274
Notes:
1 With effect from 1 April 2015, Vodacom changed its accounting for the acquisition of handsets by certain customers through Vodacom SA’s indirect distribution channels. This had the effect
of reducing equipment revenue and decreasing direct expenses, with no impact on prots or cash ows. The impact on prior years is not material.
2 Discontinued operations comprise our US group whose principal asset was a 45% interest in Verizon Wireless, which was sold on 21 February 2014. Refer to note 7 “Discontinued operations and
assets held for sale” to the consolidated nancial statements for further details.
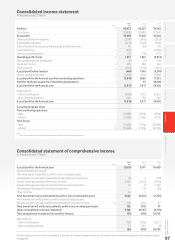
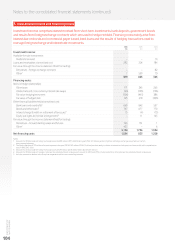
Total revenue recorded in respect of the sale of goods for the year ended 31 March 2016 was £3,269 million (2015: £3,211 million,
2014: £2,660 million).
The Group’s measure of segment prot, EBITDA, excludes depreciation, amortisation, impairment loss, restructuring costs, loss on disposal of xed
assets, the Group’s share of results in associates and joint ventures and other income and expense. A reconciliation of EBITDA to operating prot/
(loss) is shown overleaf. For a reconciliation of operating prot/(loss) to prot for the nancial year, see the consolidated income statement
on page87.