Vodafone 2016 Annual Report Download - page 100
Download and view the complete annual report
Please find page 100 of the 2016 Vodafone annual report below. You can navigate through the pages in the report by either clicking on the pages listed below, or by using the keyword search tool below to find specific information within the annual report.-
 1
1 -
2
-
3
-
4
-
5
-
6
-
7
-
8
-
9
-
10
-
11
-
12
-
13
-
14
-
15
-
16
-
17
-
18
-
19
-
20
-
21
-
22
-
23
-
24
-
25
-
26
-
27
-
28
-
29
-
30
-
31
-
32
-
33
-
34
-
35
-
36
-
37
-
38
-
39
-
40
-
41
-
42
-
43
-
44
-
45
-
46
-
47
-
48
-
49
-
50
-
51
-
52
-
53
-
54
-
55
-
56
-
57
-
58
-
59
-
60
-
61
-
62
-
63
-
64
-
65
-
66
-
67
-
68
-
69
-
70
-
71
-
72
-
73
-
74
-
75
-
76
-
77
-
78
-
79
-
80
-
81
-
82
-
83
-
84
-
85
-
86
-
87
-
88
-
89
-
 90
90 -
 91
91 -
 92
92 -
 93
93 -
 94
94 -
 95
95 -
 96
96 -
 97
97 -
 98
98 -
 99
99 -
 100
100 -
 101
101 -
 102
102 -
 103
103 -
 104
104 -
 105
105 -
 106
106 -
 107
107 -
 108
108 -
 109
109 -
 110
110 -
111
-
112
-
113
-
114
-
115
-
116
-
117
-
118
-
119
-
120
-
121
-
122
-
123
-
124
-
125
-
126
-
127
-
128
-
129
-
130
-
131
-
132
-
133
-
134
-
135
-
136
-
137
-
138
-
139
-
140
-
141
-
142
-
143
-
144
-
145
-
146
-
147
-
148
-
149
-
150
-
151
-
152
-
153
-
154
-
155
-
156
-
157
-
158
-
159
-
160
-
161
-
162
-
163
-
164
-
165
-
166
-
167
-
168
-
169
-
170
-
171
-
172
-
173
-
174
-
175
-
176
-
177
-
178
-
179
-
180
-
181
-
182
-
183
-
184
-
185
-
186
-
187
-
188
-
189
-
190
-
191
-
192
-
193
-
194
-
195
-
196
-
197
-
198
-
199
-
200
-
201
-
202
-
203
-
204
-
205
-
206
-
207
-
208
 |
 |

Vodafone Group Plc
Annual Report 2016
98
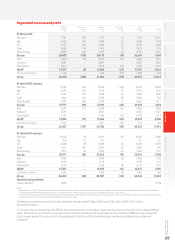
Notes to the consolidated nancial statements (continued)
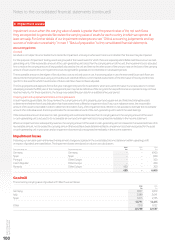
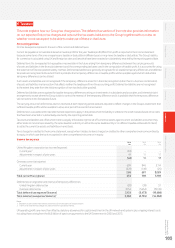
2. Segmental analysis (continued)
2016 2015 2014
£m £m £m
EBITDA 11,612 11,915 11,084
Depreciation, amortisation and loss on disposal of xed assets (8,539) (8,345) (7,098)
Share of results in associates and joint ventures 44 (63) 324
Adjusted operating prot 3,117 3,507 4,310
Impairment loss (450) –(6,600)
Restructuring costs (236) (157) (355)
Amortisation of acquired customer based and brand intangible assets (979) (1,269) (551)
Other income and expense (75) (114) (717)
Operating prot/(loss) 1,377 1,967 (3,913)
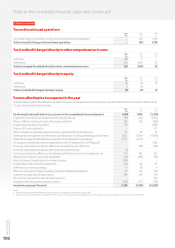
Segmental assets and cash ow
Other Depreciation Restated
Non-current Capital expenditure on and Operating
assets1expenditure2 intangible assets amortisation Impairment loss free cash ow3
£m £m £m £m £m £m
31 March 2016
Germany 22,306 1,737 1,501 2,443 – 651
Italy 7,74 8 1,12 3 170 1,223 – 373
UK 7, 5 0 8 890 103 1,393 – 265
Spain 9,14 8 867 355 1,060 – (111)
Other Europe 5,984 1,015 6 1,004 450 409
Europe 52,694 5,632 2 ,135 7,12 3 450 1,587
India 11,115 812 2,731 937 – 544
Vodacom 4,183 621 17 530 – 792
Other AMAP 5,381 864 593 859 – 385
AMAP 20,679 2,297 3,341 2,326 – 1,721
Common Functions 1,477 670 – 49 – (424)
Group 74,850 8,599 5,476 9,498 450 2,884
31 March 2015
Germany 19,521 2,003 3 2,574 – 992
Italy 6,938 1,105 95 1,334 – 542
UK 7,759 980 15 1,363 – 185
Spain 8,154 858 – 954 – (30)
Other Europe 8 ,18 9 1,083 193 1, 017 – 541
Europe 50,561 6,029 306 7,2 4 2 – 2,230
India 8,599 882 140 863 – 332
Vodacom 4,712 745 2 566 – 762
Other AMAP 4,915 919 35 900 – 398
AMAP 18,226 2,546 177 2,329 – 1,492
Common Functions 1,306 622 1 (6) – (859)
Group 70,093 9,197 484 9,565 – 2,863
31 March 2014
Germany 22,780 1,312 3 2,036 4,900 1,695
Italy 7,9 8 4 180 – 164 – 251
UK 8,031 932 – 1,290 – 602
Spain 3,653 511 – 587 800 254
Other Europe 8,736 800 273 1,047 900 978
Europe 51,184 3,735 276 5 ,124 6,600 3,780
India 7, 824 633 1,938 828 – 811
Vodacom 4,560 663 3 593 – 1,174
Other AMAP 4,850 711 11 932 – 605
AMAP 17,234 2,007 1,952 2,353 – 2,590
Common Functions 1,121 571 – 83 – 209
Group 69,539 6,313 2,228 7,560 6,600 6,579
Notes:
1 Comprises goodwill, other intangible assets and property, plant and equipment.
2 Includes additions to property, plant and equipment and computer software, reported within intangibles. Excludes licences and spectrum additions.
3 The Group’s measure of segment cash ow is reconciled to the closest equivalent GAAP measure cash generated by operations, on page 191.