Vodafone 2016 Annual Report Download - page 37
Download and view the complete annual report
Please find page 37 of the 2016 Vodafone annual report below. You can navigate through the pages in the report by either clicking on the pages listed below, or by using the keyword search tool below to find specific information within the annual report.-
 1
1 -
2
-
3
-
4
-
5
-
6
-
7
-
8
-
9
-
10
-
11
-
12
-
13
-
14
-
15
-
16
-
17
-
18
-
19
-
20
-
21
-
22
-
23
-
24
-
25
-
26
-
 27
27 -
 28
28 -
 29
29 -
 30
30 -
 31
31 -
 32
32 -
 33
33 -
 34
34 -
 35
35 -
 36
36 -
 37
37 -
 38
38 -
 39
39 -
 40
40 -
 41
41 -
 42
42 -
 43
43 -
 44
44 -
 45
45 -
 46
46 -
 47
47 -
48
-
49
-
50
-
51
-
52
-
53
-
54
-
55
-
56
-
57
-
58
-
59
-
60
-
61
-
62
-
63
-
64
-
65
-
66
-
67
-
68
-
69
-
70
-
71
-
72
-
73
-
74
-
75
-
76
-
77
-
78
-
79
-
80
-
81
-
82
-
83
-
84
-
85
-
86
-
87
-
88
-
89
-
90
-
91
-
92
-
93
-
94
-
95
-
96
-
97
-
98
-
99
-
100
-
101
-
102
-
103
-
104
-
105
-
106
-
107
-
108
-
109
-
110
-
111
-
112
-
113
-
114
-
115
-
116
-
117
-
118
-
119
-
120
-
121
-
122
-
123
-
124
-
125
-
126
-
127
-
128
-
129
-
130
-
131
-
132
-
133
-
134
-
135
-
136
-
137
-
138
-
139
-
140
-
141
-
142
-
143
-
144
-
145
-
146
-
147
-
148
-
149
-
150
-
151
-
152
-
153
-
154
-
155
-
156
-
157
-
158
-
159
-
160
-
161
-
162
-
163
-
164
-
165
-
166
-
167
-
168
-
169
-
170
-
171
-
172
-
173
-
174
-
175
-
176
-
177
-
178
-
179
-
180
-
181
-
182
-
183
-
184
-
185
-
186
-
187
-
188
-
189
-
190
-
191
-
192
-
193
-
194
-
195
-
196
-
197
-
198
-
199
-
200
-
201
-
202
-
203
-
204
-
205
-
206
-
207
-
208
 |
 |

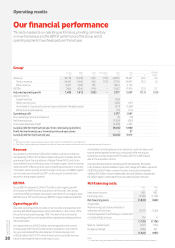
Since the launch of Project Spring we have added over 37,700 new 3G
sites, taking the total to 55,500 and our population coverage to 95%
of target urban areas. We have launched 4G in ve key circles and plan
to expand to cover over 60% of our data revenues in the coming year,
ahead of the upcoming spectrum auction.
Our M-Pesa business continues to expand, with 1.3 million active
customers at March 2016, and approximately 120,000 agents.
In August,the Reserve Bank of India granted us ‘in principle’ approval
to set up a payments bank.
EBITDA grew 4.1%*, with a 0.2* percentage point deterioration
in EBITDA margin as the benets of service revenue growth were offset
by the ongoing increase in operating costs related to Project Spring,
higher acquisition costs and the translation effects of non-rupee
operating costs.
Market conditions remain competitive and may be further
impactedby the forthcoming spectrum auctions and a new
entrant.Preparations continue for a potential IPO of Vodafone India.
Vodacom
Vodacom Group service revenue increased 5.4%* (Q3: 7.2%*; Q4: 6.3%*),
supported by strong momentum in both South Africa and the
International operations.
In South Africa, organic service revenue grew 4.7%* (Q3: 7.2%*;
Q4: 6.5%*), with the consumer and enterprise businesses both
performing well. We continued to focus on building brand and network
differentiation, with our performance driven by strong demand for data.
We further enhanced our leading network position, more than doubling
our LTE/4G sites to over 6,000, taking coverage to 58.2% on LTE/4G
and 98.9% on 3G. Data revenue growth remained strong at 18.8*%
in Q4 and data is now 36.3% of local service revenue. Our pricing
transformation strategy is making good progress, with 85% of contract
customers now on integrated price plans and churn falling to our lowest
levels at 6.9% in Q4. Total bundle sales reached 1.1 billion, supported
by our ‘Just 4 U’ personalised offers.
Service revenue growth in Vodacom’s International operations outside
South Africa was 10.0%*, driven by increased voice revenue as a result
of pricing strategies and bundle offerings, data take-up and M-Pesa.
Active data customers reached 10.1 million, 37% of total customers,
and active M-Pesa customers totalled 6.8 million in Q4, all beneting
from sustained network investment.
Vodacom Group EBITDA increased 12.7%*, signicantly faster than
revenues, with a 3.6* percentage point improvement in EBITDA margin.
This strong performance partly reected a change in accounting for
certain transactions in the indirect channel, which depressed equipment
sales and total revenues with no impact on EBITDA. Excluding this effect,
EBITDA margins rose driven by operating leverage, tight cost control and
a tailwind from foreign exchange gains.
Other AMAP
Service revenue increased 10.1%* (Q3: 10.8%*; Q4: 12.1%*), with strong
growth in Turkey, Egypt and Ghana partially offset by a decline in Qatar.
Service revenue in Turkey was up 19.7%*, reecting continued strong
growth in consumer contract and Enterprise revenue, and we launched
4G services in April 2016. Fixed line momentum was strong, almost
quadrupling the xed broadband customer base to 363,000 at the
end of the period. In Egypt, service revenue was up 8.9%* driven
by continued strong growth in data. New Zealand returned to modest
growth, with solid mobile contract customer trends and improving xed
line ARPU.
EBITDA grew 4.5%*, with a 2.1* percentage point contraction in EBITDA
margin. A strong revenue performance and improved margins in Turkey
were partly offset by higher costs for imported goods post foreign
exchange rate devaluations across the region.
Associates and joint ventures
Indus Towers, the Indian towers company in which Vodafone has a 42%
interest, achieved local currency revenue growth of 5.8%. Indus Towers
owned 119,881 towers as at 31 March 2016, with a tenancy ratio of 2.25.
Our share of Indus Towers EBITDA was £305 million and its contribution
to the Group’s adjusted operating prot was £74 million.
Safaricom, Vodafone’s 40% associate which is the leading mobile
operator in Kenya, saw local currency service revenue growth of 13.8%
for the year, with local currency EBITDA up 16.8%, driven by an increase
in the customer base leading to growth across all revenue streams,
predominantly mobile data and M-Pesa. 4G coverage is now in 20 out
of 47 counties.
Vodafone Hutchison Australia (‘VHA’), in which Vodafone owns a 50%
stake, is performing solidly in an intensely competitive environment,
with service revenues (excluding MTR impact) returning to growth
after ve years in decline. EBITDA growth was driven by an increase
in revenue and improved cost management.
Notes:
References to “Q4” are to the quarter ended 31 March 2016 unless otherwise stated.
References to “Q3” are to the quarter ended 31 December 2015 unless otherwise stated.
References to the “second half of the year” or “H2” are to the six months ended 31 March 2016
unless otherwise stated. References to the “year” or “nancial year” are to the nancial year
ended 31 March 2016 and references to the “prior nancial year” are to the nancial year ended
31 March 2015 unless otherwise stated.
All amounts marked with an “*” represent “organic growth”, which presents performance
on a comparable basis, both in terms of merger and acquisition activity as well as in terms
of movements in foreign exchange rates. See page 191 “Non-GAAP information”
for further details.
Overview Strategy review Performance Governance Financials Additional information
Vodafone Group Plc
Annual Report 2016
35