Vodafone 2016 Annual Report Download - page 204
Download and view the complete annual report
Please find page 204 of the 2016 Vodafone annual report below. You can navigate through the pages in the report by either clicking on the pages listed below, or by using the keyword search tool below to find specific information within the annual report.-
 1
1 -
2
-
3
-
4
-
5
-
6
-
7
-
8
-
9
-
10
-
11
-
12
-
13
-
14
-
15
-
16
-
17
-
18
-
19
-
20
-
21
-
22
-
23
-
24
-
25
-
26
-
27
-
28
-
29
-
30
-
31
-
32
-
33
-
34
-
35
-
36
-
37
-
38
-
39
-
40
-
41
-
42
-
43
-
44
-
45
-
46
-
47
-
48
-
49
-
50
-
51
-
52
-
53
-
54
-
55
-
56
-
57
-
58
-
59
-
60
-
61
-
62
-
63
-
64
-
65
-
66
-
67
-
68
-
69
-
70
-
71
-
72
-
73
-
74
-
75
-
76
-
77
-
78
-
79
-
80
-
81
-
82
-
83
-
84
-
85
-
86
-
87
-
88
-
89
-
90
-
91
-
92
-
93
-
94
-
95
-
96
-
97
-
98
-
99
-
100
-
101
-
102
-
103
-
104
-
105
-
106
-
107
-
108
-
109
-
110
-
111
-
112
-
113
-
114
-
115
-
116
-
117
-
118
-
119
-
120
-
121
-
122
-
123
-
124
-
125
-
126
-
127
-
128
-
129
-
130
-
131
-
132
-
133
-
134
-
135
-
136
-
137
-
138
-
139
-
140
-
141
-
142
-
143
-
144
-
145
-
146
-
147
-
148
-
149
-
150
-
151
-
152
-
153
-
154
-
155
-
156
-
157
-
158
-
159
-
160
-
161
-
162
-
163
-
164
-
165
-
166
-
167
-
168
-
169
-
170
-
171
-
172
-
173
-
174
-
175
-
176
-
177
-
178
-
179
-
180
-
181
-
182
-
183
-
184
-
185
-
186
-
187
-
188
-
189
-
190
-
191
-
192
-
193
-
 194
194 -
 195
195 -
 196
196 -
 197
197 -
 198
198 -
 199
199 -
 200
200 -
 201
201 -
 202
202 -
 203
203 -
 204
204 -
 205
205 -
 206
206 -
 207
207 -
 208
208
 |
 |

Vodafone Group Plc
Annual Report 2016
202
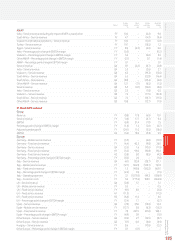
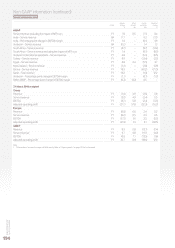
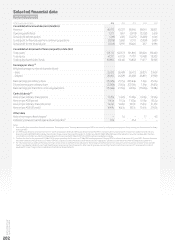
Selected nancial data
Unaudited information
At/for the year ended 31 March 2016 2015 2014 2013 2012
Consolidated income statement data (£m)
Revenue 40,973 42,227 38,346 38,041 38,821
Operating prot/(loss) 1,377 1,967 (3,913) (2,202) 5,618
(Loss)/prot before taxation (449) 1,095 (5,270) (3,483) 4,144
(Loss)/prot for nancial year from continuing operations (3,818) 5,860 11,312 (3,959) 3,439
(Loss)/prot for the nancial year (3,818) 5,917 59,420 657 6,994
Consolidated statement of nancial position data (£m)
Total assets 133,713 122,573 121,840 138,324 135,450
Total equity 67,317 67,733 71,781 72,488 78,202
Total equity shareholders’ funds 65,885 66,145 70,802 71,477 76,935
Earnings per share1,2
Weighted average number of shares (millions)
– Basic 26,692 26,489 26,472 26,831 27,624
– Diluted 26,692 26,629 26,682 26,831 27,938
Basic earnings per ordinary share (15.08)p 21.75p 223.84p 1.54p 25.15p
Diluted earnings per ordinary share (15.08)p 21.63p 222.07p 1.54p 24.87p
Basic earnings per share from continuing operations (15.08)p 21.53p 42.10p (15.66)p 12.28p
Cash dividends1,3
Amount per ordinary share (pence) 11.45p 11.22p 11.00p 10.19p 13.52p
Amount per ADS (pence) 114.5p 111.2p 110.0p 101.9p 135.2p
Amount per ordinary share (US cents) 16.49c 16.65c 18.31c 15.49c 21.63c
Amount per ADS (US cents) 164.9c 166.5c 183.1c 154.9c 216.3c
Other data
Ratio of earnings to xed charges4–1.6 –1.7 4.3
Deciency between xed charges and earnings (£m)4672 –654 – –
Notes:
1 See note 8 to the consolidated nancial statements, “Earnings per share”. Earnings and dividends per ADS is calculated by multiplying earnings per ordinary share by ten, the number of ordinary
shares per ADS.
2 On 19 February 2014, we announced a “6 for 11” share consolidation effective 24 February 2014. This had the effect of reducing the number of shares in issue from 52,821,751,216 ordinary
shares (including 4,351,833,492 ordinary shares held in Treasury) as at the close of business on 18 February 2014 to 28,811,864,298 new ordinary shares in issue immediately after the share
consolidation on 24 February 2014. Earnings per share for the years ended 31 March 2013 and 2012 have been restated accordingly.
3 The nal dividend for the year ended 31 March 2016 was proposed by the Directors on 17 May 2016 and is payable on 3 August 2016 to holders of record as of 10 June 2016. The total dividends
have been translated into USdollars at 31 March 2016 for purposes of the above disclosure but the dividends are payable in US dollars under the terms of the ADS depositary agreement.
4 For the purposes of calculating these ratios, earnings consist of loss or prot before tax adjusted for xed charges, dividend income from associates, share of prots and losses from associates,
interest capitalised and interest amortised. Fixed charges comprise one third of payments under operating leases, representing the estimated interest element of these payments, interest
payable and similar charges, interest capitalised and preferred share dividends.