Vodafone 2016 Annual Report Download - page 140
Download and view the complete annual report
Please find page 140 of the 2016 Vodafone annual report below. You can navigate through the pages in the report by either clicking on the pages listed below, or by using the keyword search tool below to find specific information within the annual report.-
 1
1 -
2
-
3
-
4
-
5
-
6
-
7
-
8
-
9
-
10
-
11
-
12
-
13
-
14
-
15
-
16
-
17
-
18
-
19
-
20
-
21
-
22
-
23
-
24
-
25
-
26
-
27
-
28
-
29
-
30
-
31
-
32
-
33
-
34
-
35
-
36
-
37
-
38
-
39
-
40
-
41
-
42
-
43
-
44
-
45
-
46
-
47
-
48
-
49
-
50
-
51
-
52
-
53
-
54
-
55
-
56
-
57
-
58
-
59
-
60
-
61
-
62
-
63
-
64
-
65
-
66
-
67
-
68
-
69
-
70
-
71
-
72
-
73
-
74
-
75
-
76
-
77
-
78
-
79
-
80
-
81
-
82
-
83
-
84
-
85
-
86
-
87
-
88
-
89
-
90
-
91
-
92
-
93
-
94
-
95
-
96
-
97
-
98
-
99
-
100
-
101
-
102
-
103
-
104
-
105
-
106
-
107
-
108
-
109
-
110
-
111
-
112
-
113
-
114
-
115
-
116
-
117
-
118
-
119
-
120
-
121
-
122
-
123
-
124
-
125
-
126
-
127
-
128
-
129
-
 130
130 -
 131
131 -
 132
132 -
 133
133 -
 134
134 -
 135
135 -
 136
136 -
 137
137 -
 138
138 -
 139
139 -
 140
140 -
 141
141 -
 142
142 -
 143
143 -
 144
144 -
 145
145 -
 146
146 -
 147
147 -
 148
148 -
 149
149 -
 150
150 -
151
-
152
-
153
-
154
-
155
-
156
-
157
-
158
-
159
-
160
-
161
-
162
-
163
-
164
-
165
-
166
-
167
-
168
-
169
-
170
-
171
-
172
-
173
-
174
-
175
-
176
-
177
-
178
-
179
-
180
-
181
-
182
-
183
-
184
-
185
-
186
-
187
-
188
-
189
-
190
-
191
-
192
-
193
-
194
-
195
-
196
-
197
-
198
-
199
-
200
-
201
-
202
-
203
-
204
-
205
-
206
-
207
-
208
 |
 |
Vodafone Group Plc
Annual Report 2016
138
Notes to the consolidated nancial statements (continued)
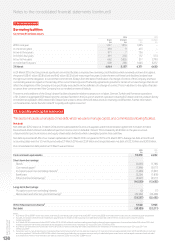
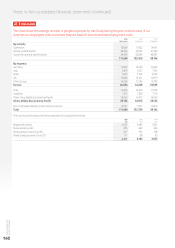
23. Capital and nancial risk management (continued)
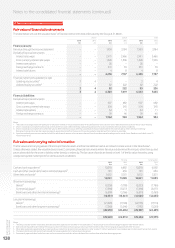
Fair value of nancial instruments
The table below sets out the valuation basis1 of nancial instruments held at fair value by the Group at 31 March.
Level 12 Level 23 Total
2016 2015 2016 2015 2016 2015
£m £m £m £m £m £m
Financial assets:
Fair value through the income statement – – 1,950 3 ,18 4 1,950 3 ,18 4
Derivative nancial instruments:
Interest rate swaps – – 2,411 2,466 2,411 2,466
Cross currency interest rate swaps – – 1,626 1,506 1,626 1,506
Interest rate options – – 36 –36 –
Foreign exchange contracts – – 231 33 231 33
Interest rate futures – – 4 8 48
– – 6,258 7,19 7 6,258 7,197
Financial investments available-for-sale:
Listed equity securities43 4 – – 3 4
Unlisted equity securities4– – 82 222 82 222
3 4 82 222 85 226
3 4 6,340 7, 419 6,343 7,423
Financial liabilities:
Derivative nancial instruments:
Interest rate swaps – – 907 682 907 682
Cross currency interest rate swaps – – 534 245 534 245
Interest rate options – – 64 11 64 11
Foreign exchange contracts – – 59 46 59 46
– – 1,564 984 1,564 984
Notes:
1 There were no changes made during the year to valuation methods or the processes to determine classication and no transfers were made between the levels in the fair value hierarchy.
2 Level 1 classication comprises nancial instruments where fair value is determined by unadjusted quoted prices in active markets for identical assets or liabilities.
3 Level 2 classication comprises items where fair value is determined from inputs other than quoted prices that are observable for the asset or liability, either directly or indirectly.
Derivative nancial instrument fair values are present values determined from future cash ows discounted at rates derived from market sourced data.
4 Listed and unlisted securities are classied as held for sale nancial assets and fair values are derived from observable quoted market prices for similar items. Details are included in note 13
“Other investments”.
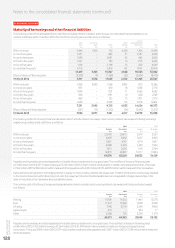
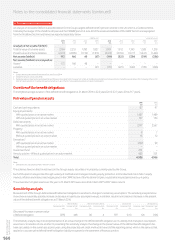
Fair value and carrying value information
The fair values and carrying values of the Group’s nancial assets and nancial liabilities held at amortised cost are set out in the table below1.
Unless otherwise stated, the valuation basis is level 2, comprising nancial instruments where fair value is determined from inputs other than quoted
prices observable for the asset or liability either directly or indirectly. The fair value of bonds are based on level 1 of the fair value hierarchy, using
unadjusted quoted market prices for identical assets or liabilities.
Fair value Carrying value
2016
£m
2015
£m
2016
£m
2015
£m
Cash and cash equivalents210,218 6,882 10,218 6,882
Cash and other investments held in restricted deposits2791 650 791 650
Other debt and bonds35,052 3, 551 5,052 3, 551
16,061 11,083 16,061 11,083
Short-term borrowings:
Bonds4(2,036) (1,798) (2,033) (1,786)
Commercial paper5(7,396) (5,077) (7,396) (5,077)
Bank loans and other short-term borrowings5(6,599) (5,766) (6,591) (5,760)
(16,031) (12,641) (16,020) (12,623)
Long-term borrowings:
Bonds4(21,693) (17,109) (22,135) (17,174)
Bank loans and other long-term borrowings5(7,260) (5,346) (7,19 2 ) (5,261)
(28,953) (22,455) (29,327) (22,435)
(28,923) (24,013) (29,286) (23,975)
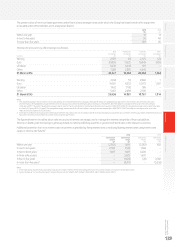
Notes:
1 The Group’s trade and other receivables and trade and other payables are not shown in the table above. The carrying amounts of both categories approximate their fair values.
2 Cash and cash equivalents are held by the Group on a short-term basis with all having a maturity of three months or less. The carrying value approximates their fair value.
3 Other debt and bonds is predominantly comprised of loan notes from Verizon Communications Inc. (refer to note 13 “Other investments”) and collateral paid on derivative nancial instruments.
4 The Group’s bonds are held at amortised cost with fair values available from market observable prices.
5 Commercial paper and other banks loans are held at amortised cost with fair values calculated from market observable data where appropriate.