Vodafone 2016 Annual Report Download - page 121
Download and view the complete annual report
Please find page 121 of the 2016 Vodafone annual report below. You can navigate through the pages in the report by either clicking on the pages listed below, or by using the keyword search tool below to find specific information within the annual report.-
 1
1 -
2
-
3
-
4
-
5
-
6
-
7
-
8
-
9
-
10
-
11
-
12
-
13
-
14
-
15
-
16
-
17
-
18
-
19
-
20
-
21
-
22
-
23
-
24
-
25
-
26
-
27
-
28
-
29
-
30
-
31
-
32
-
33
-
34
-
35
-
36
-
37
-
38
-
39
-
40
-
41
-
42
-
43
-
44
-
45
-
46
-
47
-
48
-
49
-
50
-
51
-
52
-
53
-
54
-
55
-
56
-
57
-
58
-
59
-
60
-
61
-
62
-
63
-
64
-
65
-
66
-
67
-
68
-
69
-
70
-
71
-
72
-
73
-
74
-
75
-
76
-
77
-
78
-
79
-
80
-
81
-
82
-
83
-
84
-
85
-
86
-
87
-
88
-
89
-
90
-
91
-
92
-
93
-
94
-
95
-
96
-
97
-
98
-
99
-
100
-
101
-
102
-
103
-
104
-
105
-
106
-
107
-
108
-
109
-
110
-
 111
111 -
 112
112 -
 113
113 -
 114
114 -
 115
115 -
 116
116 -
 117
117 -
 118
118 -
 119
119 -
 120
120 -
 121
121 -
 122
122 -
 123
123 -
 124
124 -
 125
125 -
 126
126 -
 127
127 -
 128
128 -
 129
129 -
 130
130 -
 131
131 -
132
-
133
-
134
-
135
-
136
-
137
-
138
-
139
-
140
-
141
-
142
-
143
-
144
-
145
-
146
-
147
-
148
-
149
-
150
-
151
-
152
-
153
-
154
-
155
-
156
-
157
-
158
-
159
-
160
-
161
-
162
-
163
-
164
-
165
-
166
-
167
-
168
-
169
-
170
-
171
-
172
-
173
-
174
-
175
-
176
-
177
-
178
-
179
-
180
-
181
-
182
-
183
-
184
-
185
-
186
-
187
-
188
-
189
-
190
-
191
-
192
-
193
-
194
-
195
-
196
-
197
-
198
-
199
-
200
-
201
-
202
-
203
-
204
-
205
-
206
-
207
-
208
 |
 |
Overview Strategy review Performance Governance Financials Additional information
Vodafone Group Plc
Annual Report 2016
119
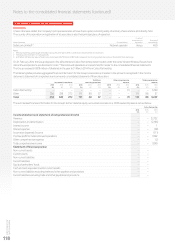
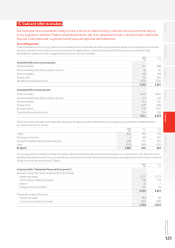
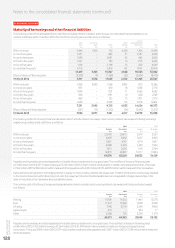
13. Other investments
We hold a number of other listed and unlisted investments, mainly comprising US$5.0 billion of loan notes from
Verizon Communications Inc.
Accounting policies
Other investments are recognised and derecognised on a trade date where a purchase or sale of an investment is under a contract whose terms
require delivery of the investment within the timeframe established by the market concerned, and are initially measured at fair value, including
transaction costs.
Other investments classied as held for trading and available-for-sale are stated at fair value. Where securities are held for trading purposes, gains
and losses arising from changes in fair value are included in net prot or loss for the period. For available-for-sale investments, gains and losses
arising from changes in fair value are recognised directly in equity, until the security is disposed of or is determined to be impaired, at which time the
cumulative gain or loss previously recognised in equity, determined using the weighted average cost method, is included in the net prot or loss for
the period.
Other investments classied as loans and receivables are stated at amortised cost using the effective interest method, less any impairment.
2016 2015
£m £m
Included within non-current assets:
Equity securities:
Listed 3 4
Unlisted 82 222
Debt securities:
Public debt and bonds 95 148
Other debt and bonds 3,482 3,383
3,662 3,757
The listed and unlisted securities are classied as available-for-sale. Public debt and bonds are classied as held for trading, and other debt and bonds
which are not quoted in an active market, are classied as loans and receivables.
Unlisted equity investments are recorded at fair value where appropriate.
Other debt and bonds includes loan notes of US$5.0 billion (£3,481 million) issued by Verizon Communications Inc. as part of the Group’s disposal
of its interest in Verizon Wireless all of which is recorded within non-current assets. The carrying amount of these loan notes approximates fair value.
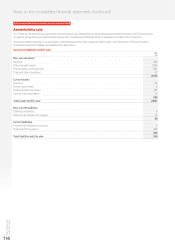
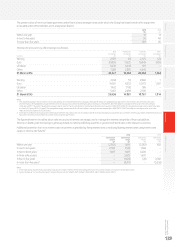
Current other investments comprise the following:
2016 2015
£m £m
Included within current assets:
Debt securities:
Public debt and bonds 888 982
Other debt and bonds 2,541 2,223
Cash and other investments held in restricted deposits 791 650
4,220 3,855
Public debt and bonds are classied as held for trading. Cash held in restricted deposits are classied as loans and receivables and include amounts
held in qualifying assets by Group insurance companies to meet regulatory requirements.
Other debt and bonds includes £967 million (2015: £2,016 million) of assets held for trading in managed investment funds with liquidity of up to 90
days and £1,574 million (2015: £38 million) of assets classied as loans and receivables comprising collateral paid on derivative nancial instruments.
Collateral passed in 2016 includes £1,460 million in relation to put options issued with regard to the mandatory convertible bonds’ hedging strategy.
Current public debt and bonds include government bonds of £659 million (2015: £830 million) which consist of highly liquid index linked gilts with
less than two years to maturity held on an effective oating rate basis.
For public debt and bonds, other debt and bonds and cash held in restricted deposits, the carrying amount approximates fair value.