Vodafone 2016 Annual Report Download - page 115
Download and view the complete annual report
Please find page 115 of the 2016 Vodafone annual report below. You can navigate through the pages in the report by either clicking on the pages listed below, or by using the keyword search tool below to find specific information within the annual report.-
 1
1 -
2
-
3
-
4
-
5
-
6
-
7
-
8
-
9
-
10
-
11
-
12
-
13
-
14
-
15
-
16
-
17
-
18
-
19
-
20
-
21
-
22
-
23
-
24
-
25
-
26
-
27
-
28
-
29
-
30
-
31
-
32
-
33
-
34
-
35
-
36
-
37
-
38
-
39
-
40
-
41
-
42
-
43
-
44
-
45
-
46
-
47
-
48
-
49
-
50
-
51
-
52
-
53
-
54
-
55
-
56
-
57
-
58
-
59
-
60
-
61
-
62
-
63
-
64
-
65
-
66
-
67
-
68
-
69
-
70
-
71
-
72
-
73
-
74
-
75
-
76
-
77
-
78
-
79
-
80
-
81
-
82
-
83
-
84
-
85
-
86
-
87
-
88
-
89
-
90
-
91
-
92
-
93
-
94
-
95
-
96
-
97
-
98
-
99
-
100
-
101
-
102
-
103
-
104
-
 105
105 -
 106
106 -
 107
107 -
 108
108 -
 109
109 -
 110
110 -
 111
111 -
 112
112 -
 113
113 -
 114
114 -
 115
115 -
 116
116 -
 117
117 -
 118
118 -
 119
119 -
 120
120 -
 121
121 -
 122
122 -
 123
123 -
 124
124 -
 125
125 -
126
-
127
-
128
-
129
-
130
-
131
-
132
-
133
-
134
-
135
-
136
-
137
-
138
-
139
-
140
-
141
-
142
-
143
-
144
-
145
-
146
-
147
-
148
-
149
-
150
-
151
-
152
-
153
-
154
-
155
-
156
-
157
-
158
-
159
-
160
-
161
-
162
-
163
-
164
-
165
-
166
-
167
-
168
-
169
-
170
-
171
-
172
-
173
-
174
-
175
-
176
-
177
-
178
-
179
-
180
-
181
-
182
-
183
-
184
-
185
-
186
-
187
-
188
-
189
-
190
-
191
-
192
-
193
-
194
-
195
-
196
-
197
-
198
-
199
-
200
-
201
-
202
-
203
-
204
-
205
-
206
-
207
-
208
 |
 |

Overview Strategy review Performance Governance Financials Additional information
Vodafone Group Plc
Annual Report 2016
113
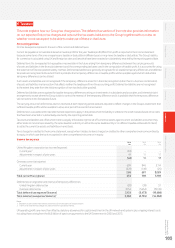
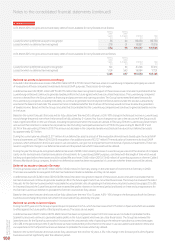
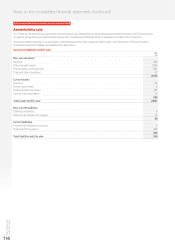
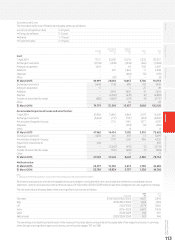
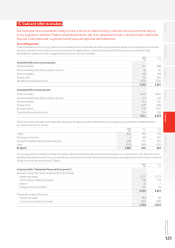
Estimated useful lives
The estimated useful lives of nite lived intangible assets are as follows:
a Licence and spectrum fees 3–25 years
a Computer software 3–5 years
a Brands 1–10 years
a Customer bases 2–10 years
Licences and Computer
Goodwill spectrum software Other Total
£m £m £m £m £m
Cost:
1 April 2014 7 7,12 1 30,592 10, 212 5,332 123, 257
Exchange movements (8,756) (1,235) (1,036) (542) (11,569)
Arising on acquisition 1,634 –48 905 2,587
Additions –467 1,844 17 2,328
Disposals – – (464) (12) (476)
Other –(20) 11 –(9)
31 March 2015 69,999 29,804 10,615 5,700 116,118
Exchange movements 5,443 1,136 688 162 7,429
Arising on acquisition 17 – 5 27 49
Additions –5,474 1,850 10 7,334
Disposal –(2,362)1(445) (2) (2,809)
Transfer of assets held for resale (680) (1,654) (374) (9) (2,717)
Other – – 98 –98
31 March 2016 74,779 32,398 12,437 5,888 125,502
Accumulated impairment losses and amortisation:
1 April 2014 53,806 13,420 6,864 2,479 76, 569
Exchange movements (6,344) (717) (707) (234) (8,002)
Amortisation charge for the year –1,751 1,491 1,277 4,519
Disposals – – (454) (12) (466)
Other – – 8–8
31 March 2015 47,462 14,454 7,202 3,510 72,628
Exchange movements 4,078 467 481 73 5,099
Amortisation charge for the year –1,707 1,559 986 4,252
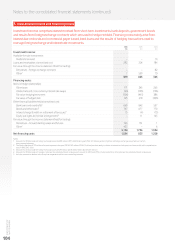
Impairment losses (note 4) 450 –––450
Disposals –(2,362)1(410) (2) (2,774)
Transfer of assets held for resale –(722) (209) (7) (938)
Other – – 17 –17
31 March 2016 51,990 13,544 8,640 4,560 78,734
Net book value:
31 March 2015 22,537 15,350 3,413 2,190 43,490
31 March 2016 22,789 18,854 3,797 1,328 46,768
Note:
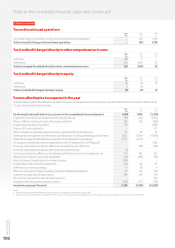
1 Disposals of licences and spectrum comprise the removal of fully amortised assets that have expired.
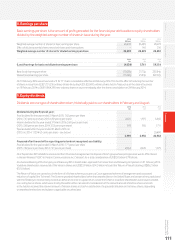
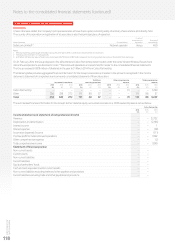
For licences and spectrum and other intangible assets, amortisation is included within the cost of sales line within the consolidated income
statement. Licences and spectrum with a net book value of £1,124 million (2015: £2,059 million) have been pledged as security against borrowings.
The net book value and expiry dates of the most signicant licences are as follows:
2016 2015
Expiry date £m £m
Germany 2016/2020/2025/2033 4,267 2,843
Italy 2018/2021/2029 1,262 1,094
UK 2023/2033 2,779 3,050
India 2016–2035 6,437 3,994
Qatar 2028/2029 942 987
Netherlands 2020/2029/2030 932 940
The remaining amortisation period for each of the licences in the table above corresponds to the expiry date of the respective licence. A summary
of the Group’s most signicant spectrum licences can be found on pages 187 and 188.