Vodafone 2016 Annual Report Download - page 38
Download and view the complete annual report
Please find page 38 of the 2016 Vodafone annual report below. You can navigate through the pages in the report by either clicking on the pages listed below, or by using the keyword search tool below to find specific information within the annual report.-
 1
1 -
2
-
3
-
4
-
5
-
6
-
7
-
8
-
9
-
10
-
11
-
12
-
13
-
14
-
15
-
16
-
17
-
18
-
19
-
20
-
21
-
22
-
23
-
24
-
25
-
26
-
27
-
 28
28 -
 29
29 -
 30
30 -
 31
31 -
 32
32 -
 33
33 -
 34
34 -
 35
35 -
 36
36 -
 37
37 -
 38
38 -
 39
39 -
 40
40 -
 41
41 -
 42
42 -
 43
43 -
 44
44 -
 45
45 -
 46
46 -
 47
47 -
 48
48 -
49
-
50
-
51
-
52
-
53
-
54
-
55
-
56
-
57
-
58
-
59
-
60
-
61
-
62
-
63
-
64
-
65
-
66
-
67
-
68
-
69
-
70
-
71
-
72
-
73
-
74
-
75
-
76
-
77
-
78
-
79
-
80
-
81
-
82
-
83
-
84
-
85
-
86
-
87
-
88
-
89
-
90
-
91
-
92
-
93
-
94
-
95
-
96
-
97
-
98
-
99
-
100
-
101
-
102
-
103
-
104
-
105
-
106
-
107
-
108
-
109
-
110
-
111
-
112
-
113
-
114
-
115
-
116
-
117
-
118
-
119
-
120
-
121
-
122
-
123
-
124
-
125
-
126
-
127
-
128
-
129
-
130
-
131
-
132
-
133
-
134
-
135
-
136
-
137
-
138
-
139
-
140
-
141
-
142
-
143
-
144
-
145
-
146
-
147
-
148
-
149
-
150
-
151
-
152
-
153
-
154
-
155
-
156
-
157
-
158
-
159
-
160
-
161
-
162
-
163
-
164
-
165
-
166
-
167
-
168
-
169
-
170
-
171
-
172
-
173
-
174
-
175
-
176
-
177
-
178
-
179
-
180
-
181
-
182
-
183
-
184
-
185
-
186
-
187
-
188
-
189
-
190
-
191
-
192
-
193
-
194
-
195
-
196
-
197
-
198
-
199
-
200
-
201
-
202
-
203
-
204
-
205
-
206
-
207
-
208
 |
 |

Consolidated statement of nancial position
The consolidated statement of nancial position is set out on page 88.
Details on the major movements of both our assets and liabilities in the
year are set out below:
Assets
Goodwill and other intangible assets
Goodwill and other intangible assets increased by £3.3 billion
to £46.8 billion. The increase primarily arose as a result of £7.3 billion
of additions, including £5.4 billion for spectrum purchased in India,
Germany, Turkey, Spain, Italy and the UK, plus £2.3 billion of favourable
movements in foreign exchange rates which were partly offset
by £4.3 billion of amortisation, £1.7 billion transferred to assets held
forresale and £0.5 billion of goodwill impairment.
Property, plant and equipment
Property, plant and equipment increased by £1.5 billion to £28.1 billion,
principally due to £6.7 billion of additions driven by investment
in the Group’s networks as a result of Project Spring plus £1.0 billion
of favourable foreign exchange movements, partly offset by £5.2 billion
of depreciation charges and £0.9 billion transferred to assets held
for resale.
Other non-current assets
Other non-current assets decreased by £2.0 billion to £30.7 billion,
mainly due to decrease in deferred tax assets primarily due to the
reduction of tax losses in Luxembourg (see note 6 for further details).
Current assets
Current assets increased by £8.3 billion to £28.1 billion, mainly due
to a £3.3 billion increase in cash and cash equivalents, £2.9 billion
of assets held for resale and a £1.1 billion increase in trade receivables.
Total equity and liabilities
Total equity
Total equity decreased by £0.4 billion to £67.3 billion as the £2.8 billion
of proceeds from the convertible bonds was offset by £3.2 billion
of dividends paid to equity shareholders and non-controlling interests
and the total comprehensive loss for the year of £0.1 billion.
Non-current liabilities
Non-current liabilities increased by £7.1 billion to £33.0 billion, primarily
due to a £6.9 billion increase in long-term borrowings.
Current liabilities
Current liabilities decreased by £4.5 billion to £33.4 billion, mainly due
to £3.4 billion of additional short-term borrowings and a £0.8 billion
increase in trade and other payables. Trade payables at 31 March 2016
were equivalent to 45 days (2015: 43days) outstanding, calculated
by reference to the amount owed to suppliers as a proportion of the
amounts invoiced by suppliers during the year. It is our policy to agree
terms of transactions, including payment terms, with suppliers and
it is our normal practice that payment is made accordingly.
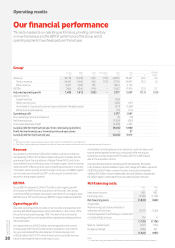
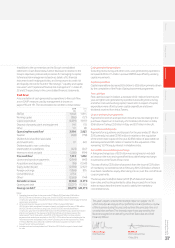
Contractual obligations and commitments
A summary of our principal contractual nancial obligations and
commitments is shown below.
Payments due by period
£m
Contractual obligations and
commitments1Total < 1 year 1–3 years 3–5 years >5 years
Borrowings2 53,816 16 ,18 8 9,999 7, 215 20,414
Operating lease
commitments3 7, 8 62 1,527 2,084 1,429 2,822
Capital
commitments3,4 2,051 1,839 178 32 2
Purchase
commitments5 6,952 3,857 2,697 2 74 124
Total 70,681 2 3 , 411 14,958 8,950 23,362
Notes:
1 This table includes commitments in respect of options over interests in Group businesses
held by non-controlling shareholders (see “Potential cash outows from option agreements
and similar arrangements” on page 133) and obligations to pay dividends to non-controlling
shareholders (see “Dividends from associates and to non-controlling shareholders”
on page 133). The table excludes current and deferred tax liabilities and obligations under
post employment benet schemes, details of which are provided in notes 6 “Taxation”
and 26 “Post employment benets” respectively. The table also excludes the contractual
obligations of associates and joint ventures.
2 See note 21 “Borrowings”.
3 See note 29 “Commitments”.
4 Primarily related to spectrum and network infrastructure.
5 Primarily related to device purchase obligations.
Dividends
We provide returns to shareholders through equity dividends and
historically have generally paid dividends in February and August
in each year. The Directors expect that we will continue to pay dividends
semi-annually.
The £3.0 billion equity dividend in the current year comprises
£2.0 billion in relation to the nal dividend for the year ended 31 March
2015 and £1.0 billion for the interim dividend for the year ended
31 March 2016.
The interim dividend of 3.68 pence per share announced by the
Directors in November 2015 represented a 2.2% increase over last
year’s interim dividend. The Directors are proposing a nal dividend
of 7.77 pence per share. Total dividends for the year increased by 2.0%
to 11.45 pence per share.
Liquidity and capital resources
Our liquidity and working capital may be affected by a material decrease
in cash ow due to a number of factors as outlined in “Principal
risk factors and uncertainties” on pages 22 to 28. We do not use
non-consolidated special purpose entities as a source of liquidity
or forother nancing purposes.
Vodafone Group Plc
Annual Report 2016
36
Financial position and resources