Vodafone 2016 Annual Report Download - page 146
Download and view the complete annual report
Please find page 146 of the 2016 Vodafone annual report below. You can navigate through the pages in the report by either clicking on the pages listed below, or by using the keyword search tool below to find specific information within the annual report.-
 1
1 -
2
-
3
-
4
-
5
-
6
-
7
-
8
-
9
-
10
-
11
-
12
-
13
-
14
-
15
-
16
-
17
-
18
-
19
-
20
-
21
-
22
-
23
-
24
-
25
-
26
-
27
-
28
-
29
-
30
-
31
-
32
-
33
-
34
-
35
-
36
-
37
-
38
-
39
-
40
-
41
-
42
-
43
-
44
-
45
-
46
-
47
-
48
-
49
-
50
-
51
-
52
-
53
-
54
-
55
-
56
-
57
-
58
-
59
-
60
-
61
-
62
-
63
-
64
-
65
-
66
-
67
-
68
-
69
-
70
-
71
-
72
-
73
-
74
-
75
-
76
-
77
-
78
-
79
-
80
-
81
-
82
-
83
-
84
-
85
-
86
-
87
-
88
-
89
-
90
-
91
-
92
-
93
-
94
-
95
-
96
-
97
-
98
-
99
-
100
-
101
-
102
-
103
-
104
-
105
-
106
-
107
-
108
-
109
-
110
-
111
-
112
-
113
-
114
-
115
-
116
-
117
-
118
-
119
-
120
-
121
-
122
-
123
-
124
-
125
-
126
-
127
-
128
-
129
-
130
-
131
-
132
-
133
-
134
-
135
-
 136
136 -
 137
137 -
 138
138 -
 139
139 -
 140
140 -
 141
141 -
 142
142 -
 143
143 -
 144
144 -
 145
145 -
 146
146 -
 147
147 -
 148
148 -
 149
149 -
 150
150 -
 151
151 -
 152
152 -
 153
153 -
 154
154 -
 155
155 -
 156
156 -
157
-
158
-
159
-
160
-
161
-
162
-
163
-
164
-
165
-
166
-
167
-
168
-
169
-
170
-
171
-
172
-
173
-
174
-
175
-
176
-
177
-
178
-
179
-
180
-
181
-
182
-
183
-
184
-
185
-
186
-
187
-
188
-
189
-
190
-
191
-
192
-
193
-
194
-
195
-
196
-
197
-
198
-
199
-
200
-
201
-
202
-
203
-
204
-
205
-
206
-
207
-
208
 |
 |

Vodafone Group Plc
Annual Report 2016
144
Notes to the consolidated nancial statements (continued)
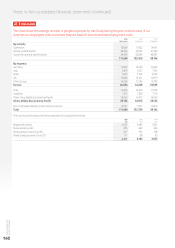
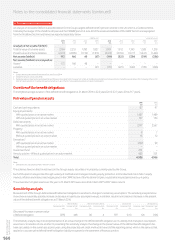
26. Post employment benets (continued)
An analysis of net assets/(decit) is provided below for the Group’s largest dened benet pension scheme in the UK, which is a funded scheme.
Following the merger of the Vodafone UK plan and the CWWRP plan on 6 June 2014 the assets and liabilities of the CWW Section are segregated
from the Vodafone Section and hence are reported separately below.
CWW Section1Vodafone Section2
2016 2015 2014 2013 2016 2015 2014 2013 2012
£m £m £m £m £m £m £m £m £m
Analysis of net assets/(decit):
Total fair value of scheme assets 2,184 2,251 1,780 1,827 1,904 1,912 1,343 1,328 1,218
Present value of schemeliabilities (2,011) (2,085) (1,732) (1,874) (2,015) (2,133) (1,677) (1,647) (1,444)
Net assets/(decit) 173 166 48 (47) (111) (221) (334) (319) (226)
Net assets/(decit) are analysed as:
Assets3173 166 48 – – – – – –
Liabilities –––(47) (111) (221) (334) (319) (226)
Notes:
1 Cable & Wireless Worldwide Retirement Plan until 6 June 2014.
2 Vodafone UK plan until 6 June 2014.
3 Pension assets are deemed to be recoverable and there are no adjustments in respect of minimum funding requirements as future economic benets are available to the Company either in the
form of future refunds or, for plans still open to benet accrual, in the form of possible reductions in future contributions.
Duration of the benet obligations
The weighted average duration of the dened benet obligation at 31 March 2016 is 22.3 years (2015: 22.7 years; 2014: 21.7 years).
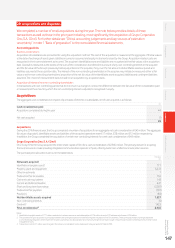
Fair value of pension assets
2016 2015
£m £m
Cash and cash equivalents 87 97
Equity investments:
With quoted prices in an active market 1,487 1,489
Without quoted prices in an active market 157 154
Debt instruments:
With quoted prices in an active market 2,747 2,567
Property:
With quoted prices in an active market 87
Without quoted prices in an active market 15 12
Derivatives:1
With quoted prices in an active market (292) 99
Without quoted prices in an active market – –
Investment fund 231 –
Annuity policies – Without quoted prices in an active market 485 531
Total 4,925 4,956
Note:
1 Derivatives include collateral held in the form of cash.
The schemes have no direct investments in the Group’s equity securities or in property currently used by the Group.
Each of the plans manages risks through a variety of methods and strategies including equity protection, to limit downside risk in falls in equity
markets, ination and interest rate hedging and, in the CWW Section of the Vodafone UK plan, a substantial insured pensioner buy-in policy.
The actual return on plan assets over the year to 31 March 2016 was a loss of £2 million (2015: £897 million return).
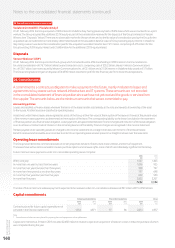
Sensitivity analysis
Measurement of the Group’s dened benet retirement obligation is sensitive to changes in certain key assumptions. The sensitivity analysis below
shows how a reasonably possible increase or decrease in a particular assumption would, in isolation, result in an increase or decrease in the present
value of the dened benet obligation as at 31 March 2016.
Rate of ination Rate of increase in salaries Discount rate Life expectancy
Decrease by 0.5%
£m
Increase by 0.5%
£m
Decrease by 0.5%
£m
Increase by 0.5%
£m
Decrease by 0.5%
£m
Increase by 0.5%
£m
Increase by 1 year
£m
Decrease by 1 year
£m
(Decrease)/increase in present value
of dened obligation (395) 448 (4) 4597 (511) 126 (126)
The sensitivity analysis may not be representative of an actual change in the dened benet obligation as it is unlikely that changes in assumptions
would occur in isolation of one another. In presenting this sensitivity analysis, the change in the present value of the dened benet obligation has
been calculated on the same basis as prior years using the projected unit credit method at the end of the reporting period, which is the same as that
applied in calculating the dened benet obligation liability recognised in the statement of nancial position.