Vodafone 2016 Annual Report Download - page 19
Download and view the complete annual report
Please find page 19 of the 2016 Vodafone annual report below. You can navigate through the pages in the report by either clicking on the pages listed below, or by using the keyword search tool below to find specific information within the annual report.-
 1
1 -
2
-
3
-
4
-
5
-
6
-
7
-
8
-
 9
9 -
 10
10 -
 11
11 -
 12
12 -
 13
13 -
 14
14 -
 15
15 -
 16
16 -
 17
17 -
 18
18 -
 19
19 -
 20
20 -
 21
21 -
 22
22 -
 23
23 -
 24
24 -
 25
25 -
 26
26 -
 27
27 -
 28
28 -
 29
29 -
30
-
31
-
32
-
33
-
34
-
35
-
36
-
37
-
38
-
39
-
40
-
41
-
42
-
43
-
44
-
45
-
46
-
47
-
48
-
49
-
50
-
51
-
52
-
53
-
54
-
55
-
56
-
57
-
58
-
59
-
60
-
61
-
62
-
63
-
64
-
65
-
66
-
67
-
68
-
69
-
70
-
71
-
72
-
73
-
74
-
75
-
76
-
77
-
78
-
79
-
80
-
81
-
82
-
83
-
84
-
85
-
86
-
87
-
88
-
89
-
90
-
91
-
92
-
93
-
94
-
95
-
96
-
97
-
98
-
99
-
100
-
101
-
102
-
103
-
104
-
105
-
106
-
107
-
108
-
109
-
110
-
111
-
112
-
113
-
114
-
115
-
116
-
117
-
118
-
119
-
120
-
121
-
122
-
123
-
124
-
125
-
126
-
127
-
128
-
129
-
130
-
131
-
132
-
133
-
134
-
135
-
136
-
137
-
138
-
139
-
140
-
141
-
142
-
143
-
144
-
145
-
146
-
147
-
148
-
149
-
150
-
151
-
152
-
153
-
154
-
155
-
156
-
157
-
158
-
159
-
160
-
161
-
162
-
163
-
164
-
165
-
166
-
167
-
168
-
169
-
170
-
171
-
172
-
173
-
174
-
175
-
176
-
177
-
178
-
179
-
180
-
181
-
182
-
183
-
184
-
185
-
186
-
187
-
188
-
189
-
190
-
191
-
192
-
193
-
194
-
195
-
196
-
197
-
198
-
199
-
200
-
201
-
202
-
203
-
204
-
205
-
206
-
207
-
208
 |
 |

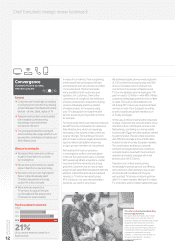
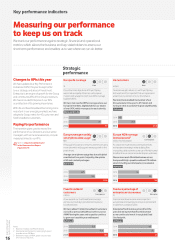
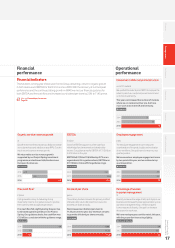
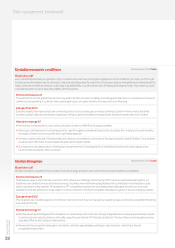
Organic service revenue growth
%
Growth in revenue demonstrates our ability to increase
our customer base and stabilise or raise ARPU. Our aim
was to return to service revenue growth.
We returned to service revenue growth
supported by our Project Spring investment
programme and achieved stabilisation in our
European businesses.
Achieved
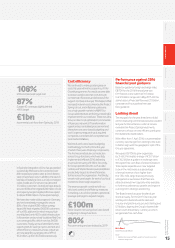
Free cash ow3
£ billion
Cash generation is key to delivering strong
shareholder returns. Our guidance was for positive
free cash ow after all capital expenditure.
Free cash ow fell slightly during the year due
to elevated capital expenditures for Project
Spring. On a guidance basis, free cash ow was
£1.0 billion, consistent with the guidance range.
Achieved
EBITDA
£ billion
Growth in EBITDA supports our free cash ow
which helps fund investment and shareholder
returns. Our guidance was for EBITDA of £11.5 billion
to £12 billion in the year.
EBITDA fell 2.5% to £11.6 billion (up 2.7% on an
organic basis). On a guidance basis, EBITDA was
£11.9 billion, in line with the guidance range.
Achieved
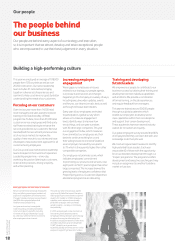
Employee engagement
index
The employee engagement score measures
a combination of the pride, loyalty and motivation
of our workforce. Our goal here is to retain our top
quartile position.
We increased our employee engagement score
by two points this year, and we retained a top
quartile position.
Achieved
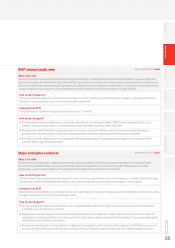
Consumer mobile net promoter score
out of 21 markets
We use Net Promoter Scores (‘NPS’) to measure the
extent to which our customers would recommend
us to friends and family.
This year we increased the number of markets
where we are ranked number one, but have
more work to do in the UK and Germany.
Achieved
Dividend per share
pence
The ordinary dividend remains the primary method
of shareholder return. We intend to increase the
dividend per share annually.
We increased our dividend per share to
11.45 pence in the year. Our intention remains
to grow the dividend per share annually.
Achieved
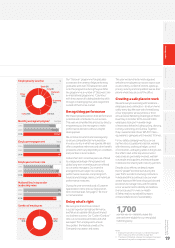
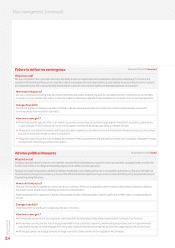
Percentage of women
in senior management
%
Diversity increases the range of skills and styles in our
business, and increased female representation across
our senior management (top c.1,500 managers)
is one measure of diversity. Our goal is to increase
theproportion each year.
We have made progress on this metric this year,
with the proportion increasing slightly.
More work to do
Financial
performance Operational
performance
Financial indicators
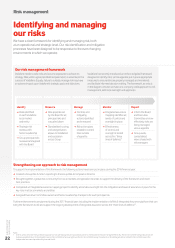
This has been a strong year of execution for the Group, delivering a return to organic growth
in both revenue and EBITDA for the rst time since 2008. With the recovery of our European
performance and the continued strong growth in AMAP, we met our nancial guidance for
both EBITDA and free cash ow and increased our dividend per share by 2.0% to 11.45 pence.
More on Financial performance:
Page 30
Overview Strategy review Performance Governance Financials Additional information
Vodafone Group Plc
Annual Report 2016
17
2014
2015
2016
–2.6
–1.6
+1.5
2014
2015
2016
11.1
11.9
11.6
2014
2015
2016
4.4
1.1
1.0
2014
2015
2016
11.00
11.22
11.45
2014
2015
2016
9
11
13
2014
2015
2016
77
77
79
2014
2015
2016
24
23
24