Vodafone 2016 Annual Report Download - page 7
Download and view the complete annual report
Please find page 7 of the 2016 Vodafone annual report below. You can navigate through the pages in the report by either clicking on the pages listed below, or by using the keyword search tool below to find specific information within the annual report.-
 1
1 -
 2
2 -
 3
3 -
 4
4 -
 5
5 -
 6
6 -
 7
7 -
 8
8 -
 9
9 -
 10
10 -
 11
11 -
 12
12 -
 13
13 -
 14
14 -
 15
15 -
 16
16 -
 17
17 -
 18
18 -
19
-
20
-
21
-
22
-
23
-
24
-
25
-
26
-
27
-
28
-
29
-
30
-
31
-
32
-
33
-
34
-
35
-
36
-
37
-
38
-
39
-
40
-
41
-
42
-
43
-
44
-
45
-
46
-
47
-
48
-
49
-
50
-
51
-
52
-
53
-
54
-
55
-
56
-
57
-
58
-
59
-
60
-
61
-
62
-
63
-
64
-
65
-
66
-
67
-
68
-
69
-
70
-
71
-
72
-
73
-
74
-
75
-
76
-
77
-
78
-
79
-
80
-
81
-
82
-
83
-
84
-
85
-
86
-
87
-
88
-
89
-
90
-
91
-
92
-
93
-
94
-
95
-
96
-
97
-
98
-
99
-
100
-
101
-
102
-
103
-
104
-
105
-
106
-
107
-
108
-
109
-
110
-
111
-
112
-
113
-
114
-
115
-
116
-
117
-
118
-
119
-
120
-
121
-
122
-
123
-
124
-
125
-
126
-
127
-
128
-
129
-
130
-
131
-
132
-
133
-
134
-
135
-
136
-
137
-
138
-
139
-
140
-
141
-
142
-
143
-
144
-
145
-
146
-
147
-
148
-
149
-
150
-
151
-
152
-
153
-
154
-
155
-
156
-
157
-
158
-
159
-
160
-
161
-
162
-
163
-
164
-
165
-
166
-
167
-
168
-
169
-
170
-
171
-
172
-
173
-
174
-
175
-
176
-
177
-
178
-
179
-
180
-
181
-
182
-
183
-
184
-
185
-
186
-
187
-
188
-
189
-
190
-
191
-
192
-
193
-
194
-
195
-
196
-
197
-
198
-
199
-
200
-
201
-
202
-
203
-
204
-
205
-
206
-
207
-
208
 |
 |
Where we operate
Our business is organised into two geographic regions: Europe, and Africa,
Middle East and Asia Pacic (‘AMAP’), which includes our emerging markets.
We provide mobile networks in 26 countries (including joint ventures and associates) and xed services in 17 of these. There are
57 markets where we hold no equity interest but have partnership agreements with local mobile operators for them to use our
products and services and in some cases our brand.
Also operating in:
Australia
(joint venture)
Egypt5
Ghana5
Kenya (associate)
New Zealand5
Qatar5
Turkey5
Also operating in:
Albania
Czech Republic5
Greece5
Hungary
Ireland5
Malta5
Netherlands5
Portugal5
Romania5
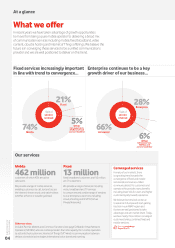
Core markets Mobile
customers Mobile
market share2
Fixed
market share2
Germany530.3m 33% 20%
UK518.2m 24% 5%
Italy524.1m 32% 6%
Spain514.3m 28% 22%
Core markets Mobile
customers Mobile
market share2
India5198.0m 22%
Vodacom3,5 70.4m 50%4
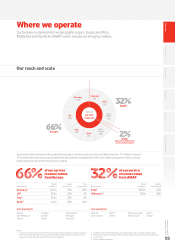
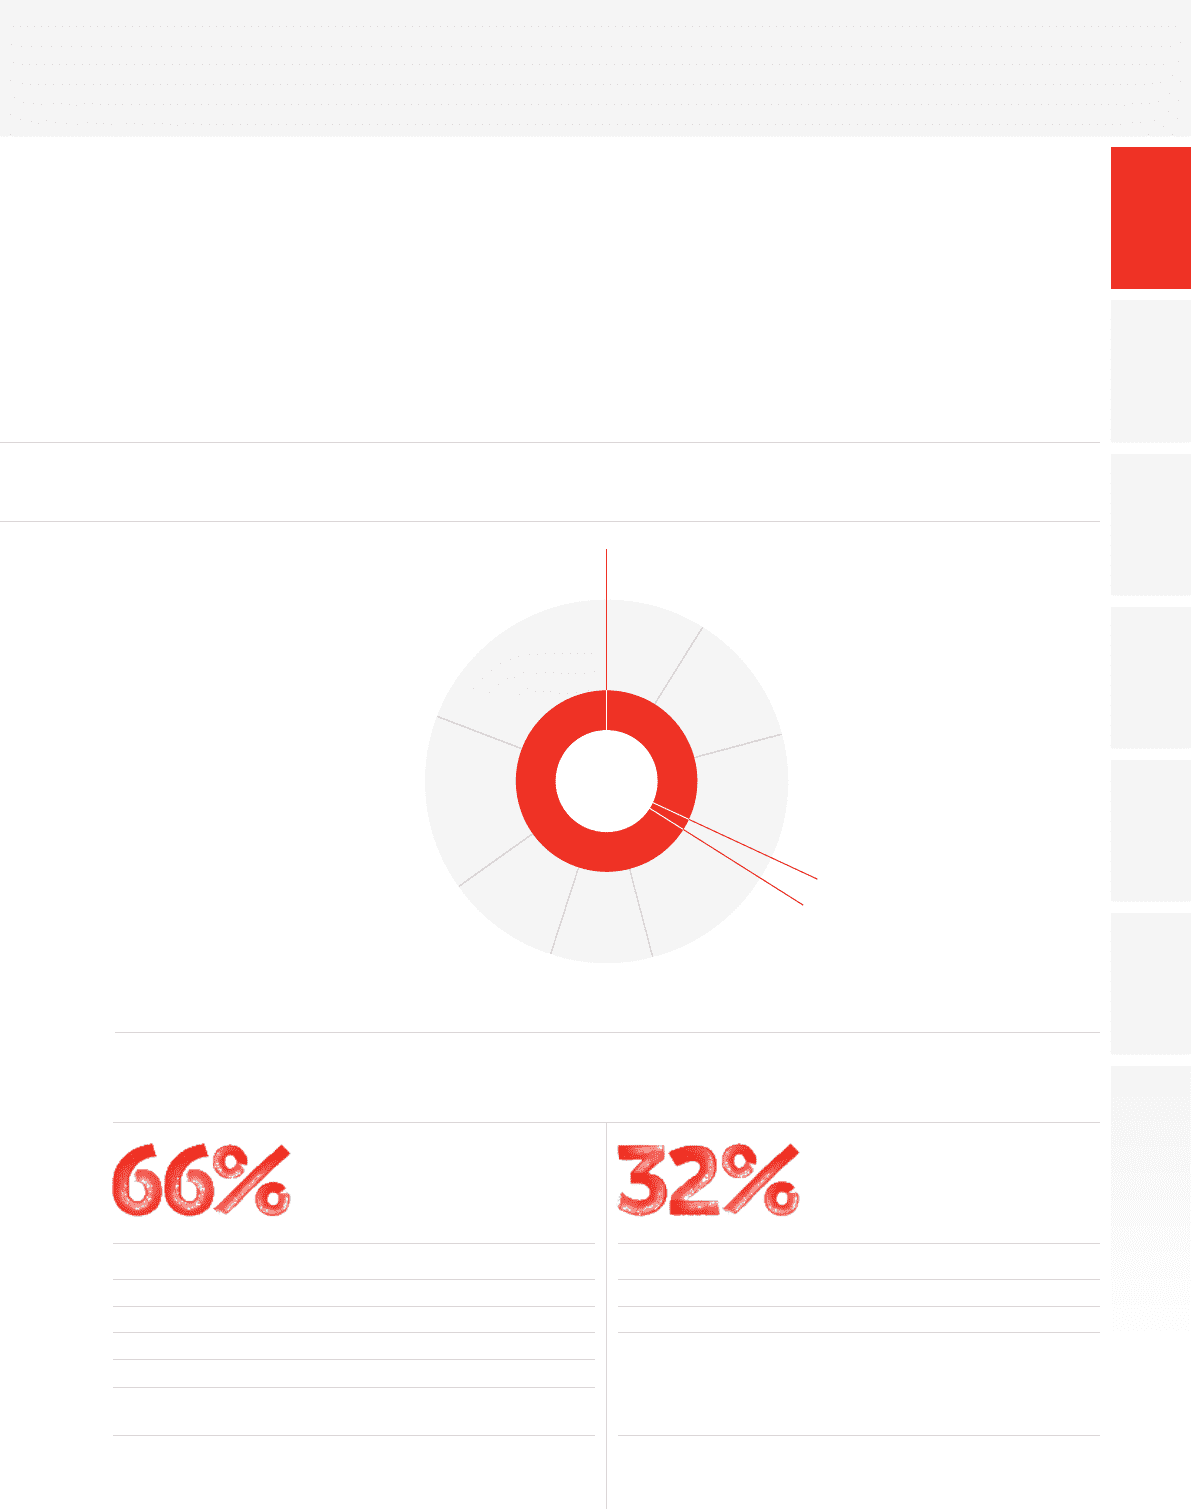
Our reach and scale
of our service
revenue comes
from Europe
of our service
revenue comes
from AMAP
2%
Other
(partner markets and
common functions1)
32%
AMAP
66%
Europe
Split of
service
revenue
Spain
9%
Italy
10%
UK
16%
Germany
19%
Vodacom
9%
India
12%
Other
Europe
12%
Other
AMAP
11%
Notes:
1 Common functions include revenue from services provided centrally or offered outside our
operating company footprint, including some markets where we have a licensed network
operation, for example offering IP-VPN services in Singapore.
2 Vodafone revenue share estimates at end December 2015. Customer share for Spain.
3 Democratic Republic of Congo (‘DRC’), Lesotho, Mozambique, South Africa and Tanzania.
4 South Africa.
5 Fixed broadband markets.
Overview Strategy review Performance Governance Financials Additional information
Vodafone Group Plc
Annual Report 2016
05