Vodafone 2016 Annual Report Download - page 109
Download and view the complete annual report
Please find page 109 of the 2016 Vodafone annual report below. You can navigate through the pages in the report by either clicking on the pages listed below, or by using the keyword search tool below to find specific information within the annual report.-
 1
1 -
2
-
3
-
4
-
5
-
6
-
7
-
8
-
9
-
10
-
11
-
12
-
13
-
14
-
15
-
16
-
17
-
18
-
19
-
20
-
21
-
22
-
23
-
24
-
25
-
26
-
27
-
28
-
29
-
30
-
31
-
32
-
33
-
34
-
35
-
36
-
37
-
38
-
39
-
40
-
41
-
42
-
43
-
44
-
45
-
46
-
47
-
48
-
49
-
50
-
51
-
52
-
53
-
54
-
55
-
56
-
57
-
58
-
59
-
60
-
61
-
62
-
63
-
64
-
65
-
66
-
67
-
68
-
69
-
70
-
71
-
72
-
73
-
74
-
75
-
76
-
77
-
78
-
79
-
80
-
81
-
82
-
83
-
84
-
85
-
86
-
87
-
88
-
89
-
90
-
91
-
92
-
93
-
94
-
95
-
96
-
97
-
98
-
 99
99 -
 100
100 -
 101
101 -
 102
102 -
 103
103 -
 104
104 -
 105
105 -
 106
106 -
 107
107 -
 108
108 -
 109
109 -
 110
110 -
 111
111 -
 112
112 -
 113
113 -
 114
114 -
 115
115 -
 116
116 -
 117
117 -
 118
118 -
 119
119 -
120
-
121
-
122
-
123
-
124
-
125
-
126
-
127
-
128
-
129
-
130
-
131
-
132
-
133
-
134
-
135
-
136
-
137
-
138
-
139
-
140
-
141
-
142
-
143
-
144
-
145
-
146
-
147
-
148
-
149
-
150
-
151
-
152
-
153
-
154
-
155
-
156
-
157
-
158
-
159
-
160
-
161
-
162
-
163
-
164
-
165
-
166
-
167
-
168
-
169
-
170
-
171
-
172
-
173
-
174
-
175
-
176
-
177
-
178
-
179
-
180
-
181
-
182
-
183
-
184
-
185
-
186
-
187
-
188
-
189
-
190
-
191
-
192
-
193
-
194
-
195
-
196
-
197
-
198
-
199
-
200
-
201
-
202
-
203
-
204
-
205
-
206
-
207
-
208
 |
 |

Overview Strategy review Performance Governance Financials Additional information
Vodafone Group Plc
Annual Report 2016
107
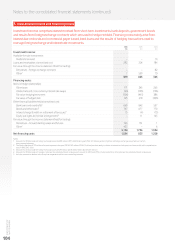
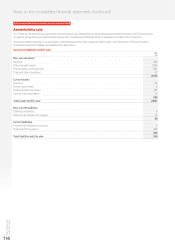
Deferred tax
Analysis of movements in the net deferred tax balance during the year:
£m
1 April 2015 23,250
Exchange movements 2,043
Charged to the income statement (continuing operations) (3,134)
Charged directly to OCI (218)
Charged directly to equity (2)
Reclassications 8
Arising on acquisition and disposals (11)
31 March 2016 21,936
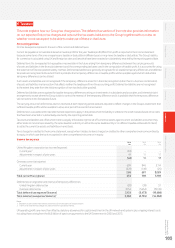
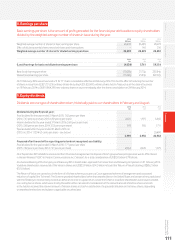
Deferred tax assets and liabilities, before offset of balances within countries, are as follows:
Amount
(charged)/
credited
in income
statement
£m
Gross
deferred
tax asset
£m
Gross
deferred tax
liability
£m
Less
amounts
unrecognised1
£m
Net
recognised
deferred tax
(liability)/
asset
£m
Accelerated tax depreciation 243 1,264 (1,309) (37) (82)
Intangible assets 27 67 (1,610) 12 (1,531)
Tax losses (3,588) 26,929 –(4,828) 22,101
Deferred tax on overseas earnings (14) –(53) –(53)
Other temporary differences 198 1,818 (98) (219) 1,501
31 March 2016 (3,134) 30,078 (3,070) (5,072) 21,936
Note:
1 Other unrecognised temporary differences include £141 million relating to Minimum Alternative Tax credits in India, of which £47 million expire within 0–5 years and £94 million expire within
6–10 years.
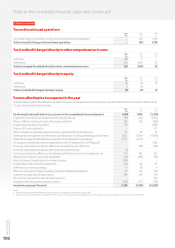
Deferred tax assets and liabilities are analysed in the statement of nancial position, after offset of balances within countries, as follows:
£m
Deferred tax asset 22,382
Deferred tax liability (446)
31 March 2016 21,936
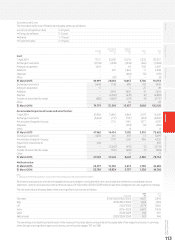
At 31 March 2015, deferred tax assets and liabilities, before offset of balances within countries, were as follows:
Amount Net
credited/ recognised
(charged) Gross Gross Less deferred tax
in income deferred deferred tax amounts (liability)/
statement tax asset liability unrecognised asset
£m £m £m £m £m
Accelerated tax depreciation 382 1,183 (1,355) (61) (233)
Intangible assets 195 107 (1,704) 13 (1,584)
Tax losses 4,866 28,080 –(4,430) 23,650
Deferred tax on overseas earnings (38) –(40) –(40)
Other temporary differences 68 1,695 (94) (144) 1,457
31 March 2015 5,473 31,065 (3,193) (4,622) 23,250
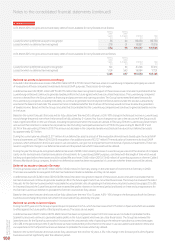
At 31 March 2015 deferred tax assets and liabilities were analysed in the statement of nancial position, after offset of balances within countries,
as follows:
£m
Deferred tax asset 23,845
Deferred tax liability (595)
31 March 2015 23,250
Factors affecting the tax charge in future years
The Group’s future tax charge, and effective tax rate, could be affected by several factors including; tax reform in countries around the world,
including any arising from the implementation of the OECD’s BEPS actions and European Commission initiatives such as the proposed anti-tax
avoidance directive, tax and nancial reporting directive or as a consequence of state aid investigations, future corporate acquisitions and disposals,
any restructuring of our businesses and the resolution of open tax issues (see below).
The Group is routinely subject to audit by tax authorities in the territories in which it operates and, specically, in India these are usually resolved
through the Indian legal system. We consider each issue on its merits and, where appropriate, hold provisions in respect of the potential tax liability
that may arise. However, the amount ultimately paid may differ materially from the amount accrued and could therefore affect the Group’s overall
protability and cash ows in future periods. See note 30 “Contingent liabilities and legal proceedings” to the consolidated nancial statements.