Vodafone 2016 Annual Report Download - page 17
Download and view the complete annual report
Please find page 17 of the 2016 Vodafone annual report below. You can navigate through the pages in the report by either clicking on the pages listed below, or by using the keyword search tool below to find specific information within the annual report.-
 1
1 -
2
-
3
-
4
-
5
-
6
-
 7
7 -
 8
8 -
 9
9 -
 10
10 -
 11
11 -
 12
12 -
 13
13 -
 14
14 -
 15
15 -
 16
16 -
 17
17 -
 18
18 -
 19
19 -
 20
20 -
 21
21 -
 22
22 -
 23
23 -
 24
24 -
 25
25 -
 26
26 -
 27
27 -
28
-
29
-
30
-
31
-
32
-
33
-
34
-
35
-
36
-
37
-
38
-
39
-
40
-
41
-
42
-
43
-
44
-
45
-
46
-
47
-
48
-
49
-
50
-
51
-
52
-
53
-
54
-
55
-
56
-
57
-
58
-
59
-
60
-
61
-
62
-
63
-
64
-
65
-
66
-
67
-
68
-
69
-
70
-
71
-
72
-
73
-
74
-
75
-
76
-
77
-
78
-
79
-
80
-
81
-
82
-
83
-
84
-
85
-
86
-
87
-
88
-
89
-
90
-
91
-
92
-
93
-
94
-
95
-
96
-
97
-
98
-
99
-
100
-
101
-
102
-
103
-
104
-
105
-
106
-
107
-
108
-
109
-
110
-
111
-
112
-
113
-
114
-
115
-
116
-
117
-
118
-
119
-
120
-
121
-
122
-
123
-
124
-
125
-
126
-
127
-
128
-
129
-
130
-
131
-
132
-
133
-
134
-
135
-
136
-
137
-
138
-
139
-
140
-
141
-
142
-
143
-
144
-
145
-
146
-
147
-
148
-
149
-
150
-
151
-
152
-
153
-
154
-
155
-
156
-
157
-
158
-
159
-
160
-
161
-
162
-
163
-
164
-
165
-
166
-
167
-
168
-
169
-
170
-
171
-
172
-
173
-
174
-
175
-
176
-
177
-
178
-
179
-
180
-
181
-
182
-
183
-
184
-
185
-
186
-
187
-
188
-
189
-
190
-
191
-
192
-
193
-
194
-
195
-
196
-
197
-
198
-
199
-
200
-
201
-
202
-
203
-
204
-
205
-
206
-
207
-
208
 |
 |

Note:
1 Before the impact of M&A, spectrum purchases and
restructuring costs.
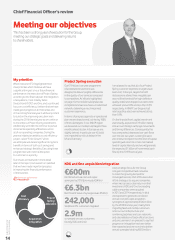
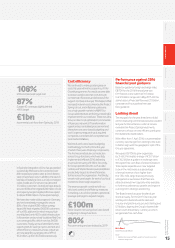
Performance against 2016
nancial year guidance
Based on guidance foreign exchange rates,
EBITDA for the 2016 nancial year was
£11.9 billion, in line with the £11.5 billion
to £12.0 billion range set in May 2015. On the
same basis our free cash ow was £1.0 billion,
consistent with our positive free cash
ow guidance.
Looking ahead
The key goals for the year ahead are to build
on the improving commercial execution evident
last year, further enhance customer service,
monetise the Project Spring investments,
continue our focus on cost efciency and grow
the dividend to shareholders.
With effect from 1 April 2016, our presentation
currency will change from sterling to the euro
to better align with the geographic split of the
Group’s operations.
We expect EBITDA to grow organically
by 3–6%; this implies a range of €15.7 billion
to €16.2 billion at guidance exchange rates.
We expect free cash ow of at least €4 billion1.
Total capital expenditure is now targeted
to be in the mid-teens as a percentage
of annual revenue; this is higher than
the 13%–14% range that we previously
anticipated, as we believe that there are
attractive investment opportunities available
to further accelerate our growth and improve
our long-term strategic positioning.
The Board intends to grow dividends per
share annually. For the 2017 nancial year
and beyond, dividends will be declared
in euros and paid in euros, pounds sterling and
US dollars, aligning the Group’s shareholder
returns with the primary currency in which
we generate free cash-ow.
Nick Read
Chief Financial Ofcer
In Spain the integration of Ono has proceeded
successfully. We have so far connected over
800 mobile base station sites to Ono’s bre to
save on backhaul costs. In addition, the launch
last May of Vodafone One, our fully converged
cable, mobile and TV service, has attracted
1.5 million customers. Overall we have already
secured 100% of the original €240 million of cost
and capex synergies targeted. We now expect
to deliver €300 million of annualised savings.
We have also made solid progress in Germany,
and we have already managed to secure
80% of the original €300 million synergy
target. We have migrated 242,000 customers
off our DSL platform (on which we pay high
monthly fees) onto KDG’s cable infrastructure.
In November, we launched Vodafone Red One,
our converged offer, which now has 54,000
customers. Finally, we have identied further
opportunities for savings in procurement and
other efciency measures and as a result we
are now targeting synergies with a NPV of
€3.5 billion, up from €3.0 billion previously.
Cost efciency
We continued to make good progress on
costs this year within the scope of our Fit for
Growth programme. As a result we were able
to reduce overall customer costs through
commercial efciencies and drive down the
support cost base in Europe. This helped offset
increased network costs driven by the Project
Spring roll-out, and inationary pressures
in our high growth markets in AMAP. Our
Group-wide initiatives are driving a meaningful
improvement in our cost base. These include a
focus on direct cost optimisation; commercial
efciencies; network & IT transformation
opportunities; centralised procurement and
shared services; zero-based budgeting; and
cost & capex synergy savings at acquired
companies, combined with comprehensive
local market initiatives.
We introduced a zero-based budgeting
methodology for the rst time this year
of which there were three key components.
The rst was an absolute cost reduction
across Group functions, which was fully
implemented in March 2016, delivering
an annual net saving of £100m. Secondly,
for Group operational units such as data
centres and Shared Services we established
productivity targets to drive efciencies
further across the organisation. And thirdly,
we set multi-year targets for each of our local
markets to drive margin expansion.
The revenue growth combined with our
strict cost control and efciency measures
is enabling us to achieve greater operational
leverage and begin to expand margins.
108%
of the mobile build target met
87%
Europe 4G coverage, slightly behind
>90%target
£1bn
incremental cash ow from Spring by 2019
£100m
Fit for Growth net savings from zero based
budgeting in Group functions
80%
Procurement spend centralised by 2019
Overview Strategy review Performance Governance Financials Additional information
Vodafone Group Plc
Annual Report 2016
15