Vodafone 2016 Annual Report Download - page 123
Download and view the complete annual report
Please find page 123 of the 2016 Vodafone annual report below. You can navigate through the pages in the report by either clicking on the pages listed below, or by using the keyword search tool below to find specific information within the annual report.-
 1
1 -
2
-
3
-
4
-
5
-
6
-
7
-
8
-
9
-
10
-
11
-
12
-
13
-
14
-
15
-
16
-
17
-
18
-
19
-
20
-
21
-
22
-
23
-
24
-
25
-
26
-
27
-
28
-
29
-
30
-
31
-
32
-
33
-
34
-
35
-
36
-
37
-
38
-
39
-
40
-
41
-
42
-
43
-
44
-
45
-
46
-
47
-
48
-
49
-
50
-
51
-
52
-
53
-
54
-
55
-
56
-
57
-
58
-
59
-
60
-
61
-
62
-
63
-
64
-
65
-
66
-
67
-
68
-
69
-
70
-
71
-
72
-
73
-
74
-
75
-
76
-
77
-
78
-
79
-
80
-
81
-
82
-
83
-
84
-
85
-
86
-
87
-
88
-
89
-
90
-
91
-
92
-
93
-
94
-
95
-
96
-
97
-
98
-
99
-
100
-
101
-
102
-
103
-
104
-
105
-
106
-
107
-
108
-
109
-
110
-
111
-
112
-
 113
113 -
 114
114 -
 115
115 -
 116
116 -
 117
117 -
 118
118 -
 119
119 -
 120
120 -
 121
121 -
 122
122 -
 123
123 -
 124
124 -
 125
125 -
 126
126 -
 127
127 -
 128
128 -
 129
129 -
 130
130 -
 131
131 -
 132
132 -
 133
133 -
134
-
135
-
136
-
137
-
138
-
139
-
140
-
141
-
142
-
143
-
144
-
145
-
146
-
147
-
148
-
149
-
150
-
151
-
152
-
153
-
154
-
155
-
156
-
157
-
158
-
159
-
160
-
161
-
162
-
163
-
164
-
165
-
166
-
167
-
168
-
169
-
170
-
171
-
172
-
173
-
174
-
175
-
176
-
177
-
178
-
179
-
180
-
181
-
182
-
183
-
184
-
185
-
186
-
187
-
188
-
189
-
190
-
191
-
192
-
193
-
194
-
195
-
196
-
197
-
198
-
199
-
200
-
201
-
202
-
203
-
204
-
205
-
206
-
207
-
208
 |
 |
Overview Strategy review Performance Governance Financials Additional information
Vodafone Group Plc
Annual Report 2016
121
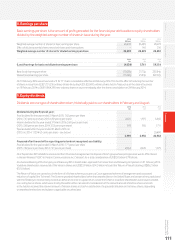
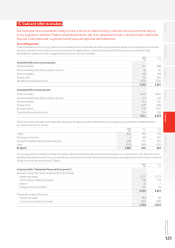
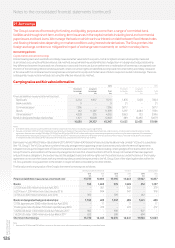
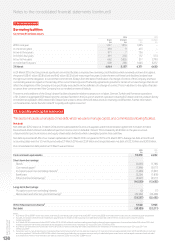
15. Trade and other receivables
Our trade and other receivables mainly consist of amounts owed to us by customers and amounts that we pay
to our suppliers in advance. Trade receivables are shown net of an allowance for bad or doubtful debts. Derivative
nancial instruments with a positive market value are reported within this note.
Accounting policies
Trade receivables do not carry any interest and are stated at their nominal value as reduced by appropriate allowances for estimated irrecoverable
amounts. Estimated irrecoverable amounts are based on the ageing of the receivable balances and historical experience. Individual trade
receivables are written off when management deems them not to be collectible.
2016 2015
£m £m
Included within non-current assets:
Trade receivables 371 288
Amounts owed by associates and joint ventures 96 85
Other receivables 493 190
Prepayments 130 566
Derivative nancial instruments 3,490 3,736
4,580 4,865
Included within current assets:
Trade receivables 4,401 3,944
Amounts owed by associates and joint ventures 173 133
Other receivables 954 930
Prepayments 1,040 938
Accrued income 1,759 1,839
Derivative nancial instruments 814 269
9,141 8,053
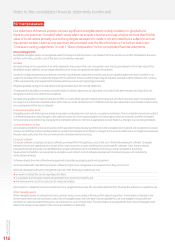
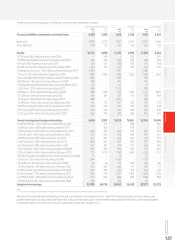
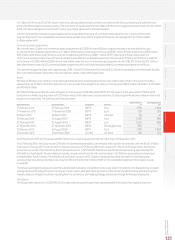
The Group’s trade receivables are stated after allowances for bad and doubtful debts based on management’s assessment of creditworthiness,
an analysis of which is asfollows:
2016 2015 2014
£m £m £m
1 April 802 589 770
Exchange movements 4(60) (67)
Amounts charged to administrative expenses 498 541 347
Other (209) (268) (461)
31 March 1,095 802 589
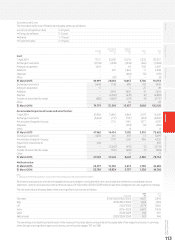
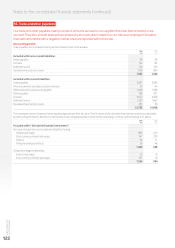
The carrying amounts of trade and other receivables approximate their fair value and are predominantly non-interest bearing. The fair values of the
derivative nancial instruments are calculated by discounting the future cash ows to net present values using appropriate market interest rates and
foreign currency rates prevailing at 31 March.
2016 2015
£m £m
Included within “Derivative nancial instruments”:
Fair value through the income statement (held for trading):
Interest rate swaps 2,027 2,378
Cross currency interest rate swaps 236 218
Options 36 –
Foreign exchange contracts 231 33
2,530 2,629
Designated hedge relationships:
Interest rate swaps 384 88
Cross currency interest rate swaps 1,390 1,288
4,304 4,005