Vodafone 2016 Annual Report Download - page 165
Download and view the complete annual report
Please find page 165 of the 2016 Vodafone annual report below. You can navigate through the pages in the report by either clicking on the pages listed below, or by using the keyword search tool below to find specific information within the annual report.-
 1
1 -
2
-
3
-
4
-
5
-
6
-
7
-
8
-
9
-
10
-
11
-
12
-
13
-
14
-
15
-
16
-
17
-
18
-
19
-
20
-
21
-
22
-
23
-
24
-
25
-
26
-
27
-
28
-
29
-
30
-
31
-
32
-
33
-
34
-
35
-
36
-
37
-
38
-
39
-
40
-
41
-
42
-
43
-
44
-
45
-
46
-
47
-
48
-
49
-
50
-
51
-
52
-
53
-
54
-
55
-
56
-
57
-
58
-
59
-
60
-
61
-
62
-
63
-
64
-
65
-
66
-
67
-
68
-
69
-
70
-
71
-
72
-
73
-
74
-
75
-
76
-
77
-
78
-
79
-
80
-
81
-
82
-
83
-
84
-
85
-
86
-
87
-
88
-
89
-
90
-
91
-
92
-
93
-
94
-
95
-
96
-
97
-
98
-
99
-
100
-
101
-
102
-
103
-
104
-
105
-
106
-
107
-
108
-
109
-
110
-
111
-
112
-
113
-
114
-
115
-
116
-
117
-
118
-
119
-
120
-
121
-
122
-
123
-
124
-
125
-
126
-
127
-
128
-
129
-
130
-
131
-
132
-
133
-
134
-
135
-
136
-
137
-
138
-
139
-
140
-
141
-
142
-
143
-
144
-
145
-
146
-
147
-
148
-
149
-
150
-
151
-
152
-
153
-
154
-
 155
155 -
 156
156 -
 157
157 -
 158
158 -
 159
159 -
 160
160 -
 161
161 -
 162
162 -
 163
163 -
 164
164 -
 165
165 -
 166
166 -
 167
167 -
 168
168 -
 169
169 -
 170
170 -
 171
171 -
 172
172 -
 173
173 -
 174
174 -
 175
175 -
176
-
177
-
178
-
179
-
180
-
181
-
182
-
183
-
184
-
185
-
186
-
187
-
188
-
189
-
190
-
191
-
192
-
193
-
194
-
195
-
196
-
197
-
198
-
199
-
200
-
201
-
202
-
203
-
204
-
205
-
206
-
207
-
208
 |
 |

Overview Strategy review Performance Governance Financials Additional information
Vodafone Group Plc
Annual Report 2016
163
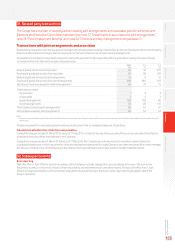
Other unaudited nancial information
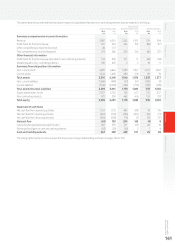
Prior year operating results
This section presents our operating performance for the 2015 nancial year compared to the 2014 nancial
year, providing commentary on how the revenue and the EBITDA performance of the Group and its operating
segments have developed over those years.
Group1,2
Restated2
Europe
£m
Restated2
AMAP
£m
Restated2
Other3
£m
Restated2
Eliminations
£m
2015
£m
2014
£m
% change
£Organic*
Revenue 27, 6 87 13,382 1,257 (99) 42,227 38,346 10 .1 (0.8)
Service revenue 25,588 11, 93 4 1,073 (98) 38,497 35 ,19 0 9.4 (1.6)
Other revenue 2,099 1,448 184 (1) 3,730 3,15 6
EBITDA 7, 8 94 4,086 (65) –11, 915 11 ,0 8 4 7. 5 (6.9)
Adjusted operating prot 1,733 1,802 (28) –3,507 4,310 (18.6) (24.1)
Adjustments for:
Impairment loss –(6,600)
Restructuring costs (157) (355)
Amortisation of acquired customer bases and brand intangible assets (1,269) (551)
Other income and expense (114) (717)
Operating loss 1,967 (3,913)
Notes:
1 2015 results reect average foreign exchange rates of £1:€1.28, £1:INR 98.51 and £1:ZAR 17.82. (2014: £1:€1.19 and £1:US$1.59).
2 The Group has amended its reporting to reect changes in the internal management of its Enterprise business. The primary change has been that on 1 April 2015, the Group redened its
segments to report international voice transit revenue and costs within Common Functions rather than within the results disclosed for each country and region. The results presented for the
year ended 31 March 2015 and 2014 have been restated onto a comparable basis. There is no impact on total Group revenue or cost.
3 The “Other” segment primarily represents the results of the partner markets and the net result of unallocated central Group costs.
Revenue
Group revenue increased by 10.1% to £42.2 billion and service revenue
increased 9.4% to £38.5 billion. Reported growth rates reect the
acquisitions of KDG in October 2013 and of Ono in July 2014, as well
as the consolidation of Italy after we increased our ownership to 100%
in February 2014.
In Europe, organic service revenue declined by 5.0%* as growing
demand for 4G and data services continues to be offset by challenging
competitive and macroeconomic pressures and the impact of MTR cuts.
In AMAP, organic service revenue increased by 5.7%* driven
by continued growth in India, Turkey, Ghana, Qatar and Egypt, partially
offset by declines in Vodacom and New Zealand.
EBITDA
Group EBITDA rose 7.5% to £11.9 billion, with organic EBITDA down
6.9%*, mainly affected by revenue declines in Europe. The Group
EBITDA margin fell 0.7 percentage points to 28.2%, or 1.8* percentage
points on an organic basis.
This reects ongoing revenue declines in Europe and the growth
in operating expenses as a result of Project Spring, partially offset
by operating efciencies. H2 EBITDA fell 3.6%*, with the improved trend
supported by the better revenue performance and continued good
cost control.
Operating loss
Adjusted operating prot excludes certain income and expenses that
we have identied separately to allow their effect on the results of the
Group to be assessed (see page 190). The items that are included
in operating prot but are excluded from adjusted operating prot are
discussed below.
No impairment losses were recognised in the 2015 nancial year
(2014: £6,600 million). Further detail is provided in note 4 to the
Group’s consolidated nancial statements. Restructuring costs
of £157 million (2014: £355 million) were incurred to improve future
business performance and reduce costs.
Note:
* All amounts in the Operating Results section marked with an “*” represent organic growth
which presents performance on a comparable basis, both in terms of merger and acquisition
activity and movements in foreign exchange rates. Refer to “Organic growth” on page 191
for further detail.