Vodafone 2016 Annual Report Download - page 128
Download and view the complete annual report
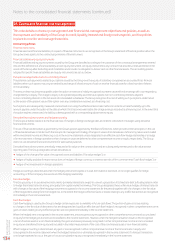
Please find page 128 of the 2016 Vodafone annual report below. You can navigate through the pages in the report by either clicking on the pages listed below, or by using the keyword search tool below to find specific information within the annual report.-
 1
1 -
2
-
3
-
4
-
5
-
6
-
7
-
8
-
9
-
10
-
11
-
12
-
13
-
14
-
15
-
16
-
17
-
18
-
19
-
20
-
21
-
22
-
23
-
24
-
25
-
26
-
27
-
28
-
29
-
30
-
31
-
32
-
33
-
34
-
35
-
36
-
37
-
38
-
39
-
40
-
41
-
42
-
43
-
44
-
45
-
46
-
47
-
48
-
49
-
50
-
51
-
52
-
53
-
54
-
55
-
56
-
57
-
58
-
59
-
60
-
61
-
62
-
63
-
64
-
65
-
66
-
67
-
68
-
69
-
70
-
71
-
72
-
73
-
74
-
75
-
76
-
77
-
78
-
79
-
80
-
81
-
82
-
83
-
84
-
85
-
86
-
87
-
88
-
89
-
90
-
91
-
92
-
93
-
94
-
95
-
96
-
97
-
98
-
99
-
100
-
101
-
102
-
103
-
104
-
105
-
106
-
107
-
108
-
109
-
110
-
111
-
112
-
113
-
114
-
115
-
116
-
117
-
 118
118 -
 119
119 -
 120
120 -
 121
121 -
 122
122 -
 123
123 -
 124
124 -
 125
125 -
 126
126 -
 127
127 -
 128
128 -
 129
129 -
 130
130 -
 131
131 -
 132
132 -
 133
133 -
 134
134 -
 135
135 -
 136
136 -
 137
137 -
 138
138 -
139
-
140
-
141
-
142
-
143
-
144
-
145
-
146
-
147
-
148
-
149
-
150
-
151
-
152
-
153
-
154
-
155
-
156
-
157
-
158
-
159
-
160
-
161
-
162
-
163
-
164
-
165
-
166
-
167
-
168
-
169
-
170
-
171
-
172
-
173
-
174
-
175
-
176
-
177
-
178
-
179
-
180
-
181
-
182
-
183
-
184
-
185
-
186
-
187
-
188
-
189
-
190
-
191
-
192
-
193
-
194
-
195
-
196
-
197
-
198
-
199
-
200
-
201
-
202
-
203
-
204
-
205
-
206
-
207
-
208
 |
 |

Vodafone Group Plc
Annual Report 2016
126
Notes to the consolidated nancial statements (continued)
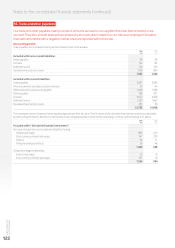
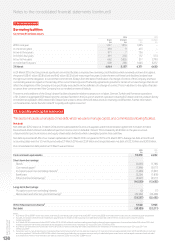
21. Borrowings
The Group’s sources of borrowing for funding and liquidity purposes come from a range of committed bank
facilities and through short-term and long-term issuances in the capital markets including bond and commercial
paper issues and bank loans. We manage the basis on which we incur interest on debt between xed interest rates
and oating interest rates depending on market conditions using interest rate derivatives. The Group enters into
foreign exchange contracts to mitigate the impact of exchange rate movements on certain monetary items.
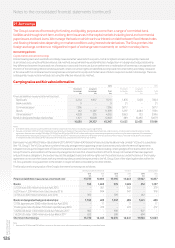
Accounting policies
Capital market and bank borrowings
Interest bearing loans and overdrafts are initially measured at fair value (which is equal to cost at inception), and are subsequently measured
at amortised cost, using the effective interest rate method, except where they are identied as a hedged item in a designated hedge relationship.
Any difference between the proceeds net of transaction costs and the amount due on settlement or redemption of borrowings is recognised over
the term of the borrowing. Where bonds issued with certain conversion rights are identied as compound instruments they are initially measured
at fair value with the nominal amounts recognised as a component in equity and the fair value of future coupons included in borrowings. These are
subsequently measured at amortised cost using the effective interest rate method.
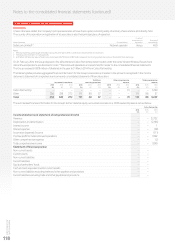
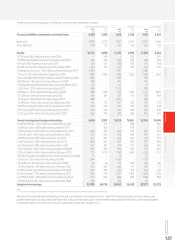
Carrying value and fair value information
2016 2015
Short-term Long-term Short-term Long-term
borrowings borrowings Total borrowings borrowings Total
£m £m £m £m £m £m
Financial liabilities measured at amortised cost:
Bank loans 2,254 6,957 9, 2 11 1,876 5,12 8 7, 0 0 4
Bank overdrafts 9 – 9 21 – 21
Commercial paper 7,396 – 7,396 5,077 – 5,077
Bonds 412 11, 2 87 11, 69 9 1,297 6,684 7, 9 81
Other liabilities1,2 4,328 235 4,563 3,863 133 3,996
Bonds in designated hedge relationships 1,621 10,848 12 ,469 489 10,490 10,979
16,020 29,327 45,347 12,623 22,435 35,058
Notes:
1 At 31 March 2016, amount includes £2,837 million (2015: £2,542 million) in relation to collateral support agreements.
2 Includes a £1.4 billion (2015: £1.3 billion) liability for payments due to holders of the equity shares in Kabel Deutschland AG under the terms of a domination and prot and loss transfer
agreement. Amount also includes £50 million (2015: £nil) and £69 million (2015: £nil) in short and long-term borrowings respectively in relation to the debt component of the mandatory
convertible bonds maturing on 25 August 2017 and 25 February 2019. These are compound instruments with nominal values recorded in equity. The initial fair value of future coupons
is recognised as debt and subsequently measured at amortised cost using the effective interest rate method.
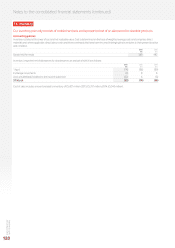
Bank loans include INR 629 billion (£6.6 billion) (2015: INR 457 billion (£4.9 billion)) of loans held by Vodafone India Limited (‘VIL’) and its subsidiaries
(the “VIL Group”). The VIL Group has a number of security arrangements supporting certain licences secured under the terms of agreements
between the Group, the Department of Telecommunications and the Government of India including certain pledges of the shares within the VIL
Group. The terms and conditions of the security arrangements mean that, should members of the VIL Group not meet all of their loan payment
and performance obligations, the lenders may sell the pledged shares and enforce rights over the certain licences under the terms of the tri-party
agreements to recover their losses, with any remaining sales proceeds being returned to the VIL Group. Each of the eight legal entities within the
VILGroup provide cross guarantees to the lenders in respect of debt contracted by the other entities.
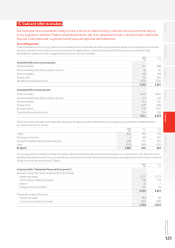
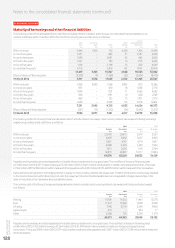
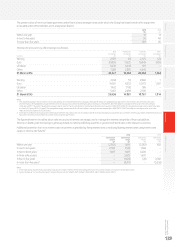
The fair value and carrying value of the Group’s short-term borrowings are as follows:
Sterling equivalentnominal value Fair value Carrying value
2016 2015 2016 2015 2016 2015
£m £m £m £m £m £m
Financial liabilities measured at amortised cost113,737 10,689 13,995 10,843 13,987 10,837
Bonds: 395 1,265 399 1,309 412 1,297
5.125% euro 500 million bond due April 2015 – 361 – 362 – 379
6.25% euro 1,250 million bond due January 2016 – 904 – 947 – 918
4.75% euro 500 million bond due June 2016 395 – 399 – 412 –
Bonds in designated hedge relationships: 1,598 489 1,637 489 1,621 489
2.15% Japanese yen 3,000 million bond due April 2015 – 17 – 17 – 17
Floating rate note US dollar 700 million due February 2016 – 472 – 472 – 472
5.625% US dollar 1,300 million bond due February 2017 903 – 939 – 927 –
1.625% US dollar 1,000 million bond due March 2017 695 – 698 – 694 –
Short-term borrowings 15,730 12,443 16,031 12,641 16,020 12,623
Note:
1 Amounts for 2016 include £50 million in relation to the short -term debt component of the mandatory convertible bonds.