Vodafone 2016 Annual Report Download - page 23
Download and view the complete annual report
Please find page 23 of the 2016 Vodafone annual report below. You can navigate through the pages in the report by either clicking on the pages listed below, or by using the keyword search tool below to find specific information within the annual report.-
 1
1 -
2
-
3
-
4
-
5
-
6
-
7
-
8
-
9
-
10
-
11
-
12
-
 13
13 -
 14
14 -
 15
15 -
 16
16 -
 17
17 -
 18
18 -
 19
19 -
 20
20 -
 21
21 -
 22
22 -
 23
23 -
 24
24 -
 25
25 -
 26
26 -
 27
27 -
 28
28 -
 29
29 -
 30
30 -
 31
31 -
 32
32 -
 33
33 -
34
-
35
-
36
-
37
-
38
-
39
-
40
-
41
-
42
-
43
-
44
-
45
-
46
-
47
-
48
-
49
-
50
-
51
-
52
-
53
-
54
-
55
-
56
-
57
-
58
-
59
-
60
-
61
-
62
-
63
-
64
-
65
-
66
-
67
-
68
-
69
-
70
-
71
-
72
-
73
-
74
-
75
-
76
-
77
-
78
-
79
-
80
-
81
-
82
-
83
-
84
-
85
-
86
-
87
-
88
-
89
-
90
-
91
-
92
-
93
-
94
-
95
-
96
-
97
-
98
-
99
-
100
-
101
-
102
-
103
-
104
-
105
-
106
-
107
-
108
-
109
-
110
-
111
-
112
-
113
-
114
-
115
-
116
-
117
-
118
-
119
-
120
-
121
-
122
-
123
-
124
-
125
-
126
-
127
-
128
-
129
-
130
-
131
-
132
-
133
-
134
-
135
-
136
-
137
-
138
-
139
-
140
-
141
-
142
-
143
-
144
-
145
-
146
-
147
-
148
-
149
-
150
-
151
-
152
-
153
-
154
-
155
-
156
-
157
-
158
-
159
-
160
-
161
-
162
-
163
-
164
-
165
-
166
-
167
-
168
-
169
-
170
-
171
-
172
-
173
-
174
-
175
-
176
-
177
-
178
-
179
-
180
-
181
-
182
-
183
-
184
-
185
-
186
-
187
-
188
-
189
-
190
-
191
-
192
-
193
-
194
-
195
-
196
-
197
-
198
-
199
-
200
-
201
-
202
-
203
-
204
-
205
-
206
-
207
-
208
 |
 |

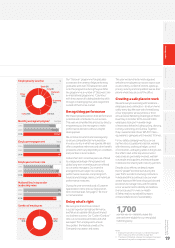
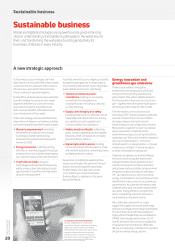
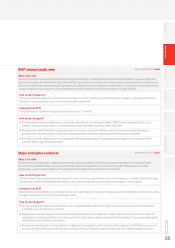
Our total greenhouse gas emissions in 2016
were 4% higher than in 2015 at 2.57 million
tonnes of CO2e (carbon dioxide equivalent),
as a consequence of a 71% increase
in the volume of data carried across our
mobile networks. However, our measure
of greenhouse gas efciency improved
greatly: annual greenhouse gas emissions
per petabyte of data carried by our mobile
networks were 40% lower than in 2015,
dropping to an average of 1,900 tonnes CO2e/
petabyte.
Our technologies and services also provide
our customers with the means to make
a meaningful reduction in their own emissions,
most notably through the deployment
of Internet of Things (‘IoT’) applications –
a eld in which we are the world’s leading
mobile provider. Using network intelligence
to optimise energy use in a wide variety
of machines, devices and processes could
account for a 20% reduction in projected
global CO2e emissions by 2030 – enabling
emissions to remain at 2015 levels1.
In 2015, we announced a new goal under
which we would seek to help our customers
reduce their CO2e emissions by two tonnes for
every one tonne of emissions from our own
operations. We aim to achieve that goal by the
end of March 2018. As of the end of March
2016, we were well on track to do so, helping
our customers to save 1.74 tonnes of CO2e
for every tonne of CO2e generated through
our activities.
We estimate that more than 30% of the
38 million IoT connections operated
by Vodafone directly enable our customers
to reduce their emissions. The total emissions
avoided as a consequence of our IoT
technologies and services in 2016 increased
by 29%, over the same period in 2015, to reach
4.5 million tonnes CO2e.
We provide further details of our approach
to energy innovation in our annual Sustainable
Business Report.
Human Rights
Communications technologies play
an important role in underpinning human
rights, enabling citizens to share information
and exercise freedom of expression. However,
many governments are concerned that
these technologies are also empowering
people intent on harm, such as criminals and
terrorists; conversely, civil society groups are
concerned that state actions to address the
malign use of communications technologies
have the effect of eroding the individual’s right
to privacy.
Human rights that extend in to the digital
realm are important priorities for Vodafone
– as can be seen in our Law Enforcement
Disclosure Report. However, we are also
fully mindful of other human rights risks
in our operations – as our Code of Conduct
makes clear – which are the focus of senior
management scrutiny across all of our
businesses. These include labour rights
(particularly with regard to our supply chain)
and economic, social and cultural rights.
Details of our principles, rules and compliance
programmes in response to those risks are set
out in our annual Sustainable Business Report
including a statement – as stipulated under the
UK Modern Slavery Act (2015) – summarising
our actions to address the risk of modern
slavery within our own operations and those
of our suppliers and sub-suppliers. The Report
also provides details of our ongoing work with
our suppliers and other industry stakeholders
to improve ethical, labour and environmental
standards across our supply chain.
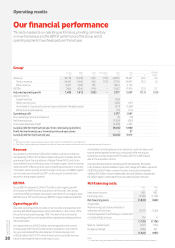
Greenhouse gas (‘GHG’) emissions
million tonnes of CO2e
2014
2015
2016
2.04 2.38
2.10 2.47
2.16 2.57
0.34
0.37
0.41
Scope 1 emissions (over which we have direct control)
Scope 2 emissions (from purchased electricity)
Total of Scope 1 and Scope 2
Note:
Calculated using local market actual or estimated data
sourced from invoices, purchasing requisitions, direct
data measurement and estimations. Carbon emissions
calculated in line with GHG Protocol standards. The 2014
and 2015 values have been re-based in accordance
with revised Scope 2 guidance. Scope 2 emissions are
reported using the market-based methodology. For full
methodology see our Sustainable Business Report 2016.
Greenhouse gas emissions per petabyte
of data carried by our mobile networks
tonnes of CO2e
2014
2015
2016
8,200
3,10 0
1,900
Ratio of GHG emission savings for
customers to our own GHG footprint
2014
2015
2016
2018
1.19
1.41
1.74
2.00Target
Note:
Figures include all data carried by our mobile networks
with an adjustment to include only part of the data
carried in India, where only base stations under
Vodafone’s operational control are included in our
greenhouse gas emissions totals.
Note:
2014 gures have been extrapolated from
actuals for 2013 and 2015. Emissions savings for
customers have been calculated based on GeSI’s ICT
Enablement Methodology.
Our Sustainable Business Report 2016:
www.vodafone.com/sustainability/
report2016
Overview Strategy review Performance Governance Financials Additional information
Vodafone Group Plc
Annual Report 2016
21
Note:
1 Smarter Report 2030, Global e-Sustainability Initiative
(GeSI) June 2015.