Vodafone 2016 Annual Report Download - page 117
Download and view the complete annual report
Please find page 117 of the 2016 Vodafone annual report below. You can navigate through the pages in the report by either clicking on the pages listed below, or by using the keyword search tool below to find specific information within the annual report.-
 1
1 -
2
-
3
-
4
-
5
-
6
-
7
-
8
-
9
-
10
-
11
-
12
-
13
-
14
-
15
-
16
-
17
-
18
-
19
-
20
-
21
-
22
-
23
-
24
-
25
-
26
-
27
-
28
-
29
-
30
-
31
-
32
-
33
-
34
-
35
-
36
-
37
-
38
-
39
-
40
-
41
-
42
-
43
-
44
-
45
-
46
-
47
-
48
-
49
-
50
-
51
-
52
-
53
-
54
-
55
-
56
-
57
-
58
-
59
-
60
-
61
-
62
-
63
-
64
-
65
-
66
-
67
-
68
-
69
-
70
-
71
-
72
-
73
-
74
-
75
-
76
-
77
-
78
-
79
-
80
-
81
-
82
-
83
-
84
-
85
-
86
-
87
-
88
-
89
-
90
-
91
-
92
-
93
-
94
-
95
-
96
-
97
-
98
-
99
-
100
-
101
-
102
-
103
-
104
-
105
-
106
-
 107
107 -
 108
108 -
 109
109 -
 110
110 -
 111
111 -
 112
112 -
 113
113 -
 114
114 -
 115
115 -
 116
116 -
 117
117 -
 118
118 -
 119
119 -
 120
120 -
 121
121 -
 122
122 -
 123
123 -
 124
124 -
 125
125 -
 126
126 -
 127
127 -
128
-
129
-
130
-
131
-
132
-
133
-
134
-
135
-
136
-
137
-
138
-
139
-
140
-
141
-
142
-
143
-
144
-
145
-
146
-
147
-
148
-
149
-
150
-
151
-
152
-
153
-
154
-
155
-
156
-
157
-
158
-
159
-
160
-
161
-
162
-
163
-
164
-
165
-
166
-
167
-
168
-
169
-
170
-
171
-
172
-
173
-
174
-
175
-
176
-
177
-
178
-
179
-
180
-
181
-
182
-
183
-
184
-
185
-
186
-
187
-
188
-
189
-
190
-
191
-
192
-
193
-
194
-
195
-
196
-
197
-
198
-
199
-
200
-
201
-
202
-
203
-
204
-
205
-
206
-
207
-
208
 |
 |

Overview Strategy review Performance Governance Financials Additional information
Vodafone Group Plc
Annual Report 2016
115
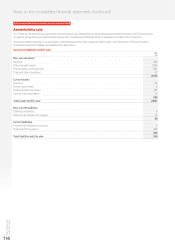
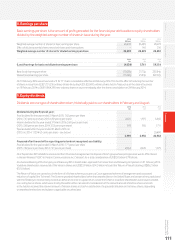
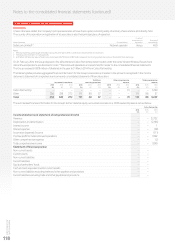
Equipment,
Land and xtures
buildings and ttings Total
£m £m £m
Cost:
1 April 2014 1,646 48,563 50,209
Exchange movements (117) (4,107) (4,224)
Arising on acquisition 73,443 3,450
Additions 172 7,181 7,353
Disposals (52) (1,664) (1,716)
Other 13 14 27
31 March 2015 1,669 53,430 55,099
Exchange movements 33 2.382 2,415
Additions 133 6,608 6,741
Disposals (37) (1,583) (1,620)
Transfer of assets held for resale (2) (1,769) (1,771)
Other 96 (172) (76)
31 March 2016 1,892 58,896 60,788
Accumulated depreciation and impairment:
1 April 2015 732 26,626 27,358
Exchange movements (62) (2,296) (2,358)
Charge for the year 118 4,928 5,046
Disposals (24) (1,550) (1,574)
Other (10) 34 24
31 March 2015 754 27,742 28,496
Exchange movements 31 1,375 1,406
Charge for the year 131 5,115 5,246
Disposals (26) (1,488) (1,514)
Transfer of assets held for resale (2) (922) (924)
Other 14 (18) (4)
31 March 2016 902 31,804 32,706
Net book value:
31 March 2015 915 25,688 26,603
31 March 2016 990 27,092 28,082
The net book value of land and buildings and equipment, xtures and ttings includes £27 million and £592 million respectively (2015: £24 million
and £468 million) in relation to assets held under nance leases.
Included in the net book value of land and buildings and equipment, xtures and ttings are assets in the course of construction, which are not
depreciated, with a cost of £26 million and £1,527 million respectively (2015: £85 million and £1,705 million).
Property, plant and equipment with a net book value of £nil (2015: £nil) has been pledged as security against borrowings.