Vodafone 2016 Annual Report Download - page 68
Download and view the complete annual report
Please find page 68 of the 2016 Vodafone annual report below. You can navigate through the pages in the report by either clicking on the pages listed below, or by using the keyword search tool below to find specific information within the annual report.-
 1
1 -
2
-
3
-
4
-
5
-
6
-
7
-
8
-
9
-
10
-
11
-
12
-
13
-
14
-
15
-
16
-
17
-
18
-
19
-
20
-
21
-
22
-
23
-
24
-
25
-
26
-
27
-
28
-
29
-
30
-
31
-
32
-
33
-
34
-
35
-
36
-
37
-
38
-
39
-
40
-
41
-
42
-
43
-
44
-
45
-
46
-
47
-
48
-
49
-
50
-
51
-
52
-
53
-
54
-
55
-
56
-
57
-
 58
58 -
 59
59 -
 60
60 -
 61
61 -
 62
62 -
 63
63 -
 64
64 -
 65
65 -
 66
66 -
 67
67 -
 68
68 -
 69
69 -
 70
70 -
 71
71 -
 72
72 -
 73
73 -
 74
74 -
 75
75 -
 76
76 -
 77
77 -
 78
78 -
79
-
80
-
81
-
82
-
83
-
84
-
85
-
86
-
87
-
88
-
89
-
90
-
91
-
92
-
93
-
94
-
95
-
96
-
97
-
98
-
99
-
100
-
101
-
102
-
103
-
104
-
105
-
106
-
107
-
108
-
109
-
110
-
111
-
112
-
113
-
114
-
115
-
116
-
117
-
118
-
119
-
120
-
121
-
122
-
123
-
124
-
125
-
126
-
127
-
128
-
129
-
130
-
131
-
132
-
133
-
134
-
135
-
136
-
137
-
138
-
139
-
140
-
141
-
142
-
143
-
144
-
145
-
146
-
147
-
148
-
149
-
150
-
151
-
152
-
153
-
154
-
155
-
156
-
157
-
158
-
159
-
160
-
161
-
162
-
163
-
164
-
165
-
166
-
167
-
168
-
169
-
170
-
171
-
172
-
173
-
174
-
175
-
176
-
177
-
178
-
179
-
180
-
181
-
182
-
183
-
184
-
185
-
186
-
187
-
188
-
189
-
190
-
191
-
192
-
193
-
194
-
195
-
196
-
197
-
198
-
199
-
200
-
201
-
202
-
203
-
204
-
205
-
206
-
207
-
208
 |
 |
Annual Report on remuneration (continued)
2016 remuneration
In this section we summarise the pay packages awarded to our Executive Directors for performance in the 2016 nancial year versus 2015.
Specically we have provided a table that shows all remuneration that was earned by each individual during the year and computed a single total
remuneration gure for the year. The value of the annual bonus (‘GSTIP’) reects what was earned in respect of the year but will be paid out in cash
in the following year. Similarly the value of the long-term incentive (‘GLTI’) reects the share awards which will vest in June 2016 as a result of the
performance through the three year period ended at the completion of our nancial year on 31 March 2016.
The Remuneration Committee reviews all incentive awards prior to payment and uses judgement to ensure that the nal assessments of performance
are fair and appropriate. If circumstances warrant it, the Committee may adjust the nal payment or vesting downwards. On this occasion, based on the
fact that nal annual bonus payout and nal vesting level long-term incentives awards GLTI were deemed to be an accurate reection of performance
and were considered fair and appropriate, the Committee did not use its discretion to adjust nal outcomes.
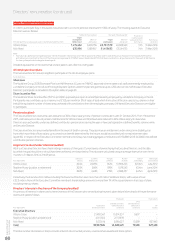
Total remuneration for the 2016 nancial year (audited)
Vittorio Colao Stephen Pusey1Nick Read
2016
£’000
2015
£’000
2016
£’000
2015
£’000
2016
£’000
2015
£’000
Salary/fees 1,150 1,140 200 594 694 675
Taxable benets232 40 721 26 28
Annual bonus: GSTIP (see below for further detail) 1,342 1,287 233 671 817 755
Total long-term incentive: 2,429 –754 –1,412 –
GLTI vesting during the year3 2,102 –653 –861 –
Cash in lieu of GLTI dividends4327 –101 –134 –
GLTR vesting during the year5– – – – 380 –
GLTR dividend equivalent shares6– – – – 37 –
Cash in lieu of pension 316 342 60 178 191 203
Other71 1 – – 1 1
Total 5,270 2,810 1,254 1,464 3,141 1,662
Notes:
1 Stephen Pusey stepped down from the Board following the AGM held on 28 July 2015 and retired on 31 July 2015.
2 Taxable benets include amounts in respect of: – Private healthcare (2016: £1,946; 2015: £1,854);
– Cash car allowance £19,200 p.a.; and
– Travel (2016: Vittorio Colao £10,764, Nick Read £4,546; 2015: Vittorio Colao £18,022; Nick Read £7,164).
3 The value shown in the 2016 column is the award which vests on 26 June 2016 and is valued using an average of closing share price over the last quarter of the 2016 financial year of 216.59 pence.
4 Participants also receive a cash award, equivalent in value to the dividends that would have been paid during the vesting period on any shares that vest. The cash in lieu of dividend value
shown in 2016 relates to the award which vests on 26 June 2016.
5 On 26 June 2013, prior to his appointment to the Board, Nick Read was granted a GLTR share award which was subject to a continued employment condition. This award subsequently
vestedon June 2015 following the fullment of the continued employment condition. The value shown in the 2016 column in respect of Nick Read is based on the execution share price
on 26 June 2015 of 238.09 pence.
6 Nick Read received an award of 15,620 dividend equivalent shares in respect of the GLTR share award which vested on 26 June 2015.
7 Reects the value of the SAYE benet which is calculated as £250 x 12 months x 20% to reect the discount applied based on savings made during the year.
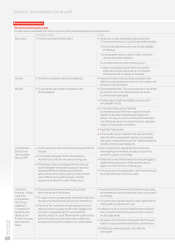
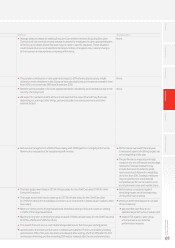
2016 annual bonus (‘GSTIP’) payout (audited)
In the table below we disclose our achievement against each of the performance measures and targets in our annual bonus (‘GSTIP’) and the
resulting total annual bonus payout level for the year ended 31 March 2016 of 116.7%. This is applied to the target bonus level of 100% of base salary
for each executive. Commentary on our performance against each measure is provided below the table.
Performance measure
Payout at
target
performance
100%
Payout at
maximum
performance
200%
Actual
payout
%
Threshold
performance
level
£bn
Target
performance
level
£bn
Maximum
performance
level
£bn
Actual
performance
level1
£bn
Service revenue 20% 40% 20.7% 37.2 39.2 41.1 39.2
EBITDA 20% 40% 23.7% 11.4 12.2 13.1 12.4
Adjusted free cash ow 20% 40% 30.7% 0.1 0.7 1.3 1.0
Customer Appreciation KPIs 40% 80% 41.6% See below for further details
Total annual bonus payout level 100% 200% 116.7%
Note:
1 These gures are adjusted to include the removal of the impact of M&A, foreign exchange movements and any changes in accounting treatment.
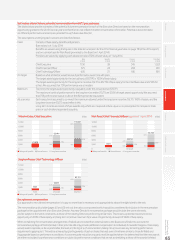
During the year under review, service revenue performance was slightly above budget, with both Europe and AMAP regions recording above
target performances. EBITDA results also demonstrated above target performance, with both Europe and AMAP again recording equally strong
performances. With regards to Adjusted Free Cash Flow, overall performance reected particularly strong AMAP performance, with our Europe
region recording below target results.
An assessment of performance under the Customer Appreciation KPIs measure was conducted on a market by market basis, with these scores
then being subject to a revenue-weighted average to give an overall performance achievement. Performance was primarily judged against
an assessment of net promoter score and brand consideration for both consumer and enterprise operations, where applicable, within each market.
Additional consideration was then given to other relevant factors including customer churn rates and revenue market share. Group performance for
the year was slightly above target reecting our position as Consumer NPS leader in 13 out of 21 markets – an increase from our previous position
as leader in 11 markets.
Directors’ remuneration (continued)
Vodafone Group Plc
Annual Report 2016
66