Vodafone 2016 Annual Report Download - page 35
Download and view the complete annual report
Please find page 35 of the 2016 Vodafone annual report below. You can navigate through the pages in the report by either clicking on the pages listed below, or by using the keyword search tool below to find specific information within the annual report.-
 1
1 -
2
-
3
-
4
-
5
-
6
-
7
-
8
-
9
-
10
-
11
-
12
-
13
-
14
-
15
-
16
-
17
-
18
-
19
-
20
-
21
-
22
-
23
-
24
-
 25
25 -
 26
26 -
 27
27 -
 28
28 -
 29
29 -
 30
30 -
 31
31 -
 32
32 -
 33
33 -
 34
34 -
 35
35 -
 36
36 -
 37
37 -
 38
38 -
 39
39 -
 40
40 -
 41
41 -
 42
42 -
 43
43 -
 44
44 -
 45
45 -
46
-
47
-
48
-
49
-
50
-
51
-
52
-
53
-
54
-
55
-
56
-
57
-
58
-
59
-
60
-
61
-
62
-
63
-
64
-
65
-
66
-
67
-
68
-
69
-
70
-
71
-
72
-
73
-
74
-
75
-
76
-
77
-
78
-
79
-
80
-
81
-
82
-
83
-
84
-
85
-
86
-
87
-
88
-
89
-
90
-
91
-
92
-
93
-
94
-
95
-
96
-
97
-
98
-
99
-
100
-
101
-
102
-
103
-
104
-
105
-
106
-
107
-
108
-
109
-
110
-
111
-
112
-
113
-
114
-
115
-
116
-
117
-
118
-
119
-
120
-
121
-
122
-
123
-
124
-
125
-
126
-
127
-
128
-
129
-
130
-
131
-
132
-
133
-
134
-
135
-
136
-
137
-
138
-
139
-
140
-
141
-
142
-
143
-
144
-
145
-
146
-
147
-
148
-
149
-
150
-
151
-
152
-
153
-
154
-
155
-
156
-
157
-
158
-
159
-
160
-
161
-
162
-
163
-
164
-
165
-
166
-
167
-
168
-
169
-
170
-
171
-
172
-
173
-
174
-
175
-
176
-
177
-
178
-
179
-
180
-
181
-
182
-
183
-
184
-
185
-
186
-
187
-
188
-
189
-
190
-
191
-
192
-
193
-
194
-
195
-
196
-
197
-
198
-
199
-
200
-
201
-
202
-
203
-
204
-
205
-
206
-
207
-
208
 |
 |

Italy
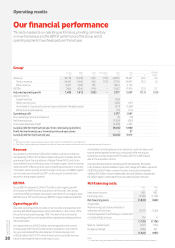
Service revenue declined 0.8%* for the year, but returned to growth
in Q4 (Q3: -0.3%*; Q4: 1.3%*), aided by the leap-year benet. The mobile
business is on a steady recovery path, while xed line performance
continues to be positive despite increased competition in recent months.
Mobile service revenue declined 1.1%*, as a recovery in ARPU supported
by prepaid price increases only partially offset the year-on-year decline
in the customer base. Mobile number portability in the market has
reduced in recent quarters and the customer base decline stabilised
during the year, aided by market-leading NPS scores in mobile following
our Project Spring investments. Consumer trends improved faster
than Enterprise, where competitive intensity has increased in H2.
As of 31 March 2016 we have 95% population coverage on our 4G
network and 6.5 million 4G customers (September 2015: 4.0 million).
Fixed service revenue was up 1.2%*, driven by sustained commercial
momentum. We added 168,000 broadband customers during the
year, a strong performance, and in Q4 50% of our gross adds have
taken a bre-based service. Of our base of 2.0 million broadband
customers, 297,000 are bre customers. We have now built out our
own bre network to over 16,000 cabinets, enabling us to reach
3.6 million households. Our high speed broadband rollout in Italy will
be enhanced by our commercial agreement with Enel, which plans
to roll out Fibre-To-The-Home (FTTH) to 224 cities nationwide, providing
access on competitive commercial terms. In these areas Enel will be our
exclusive bre partner going forward.
EBITDA was up 3.1%*, as we successfully offset the decline in service
revenue with savings in commercial costs and operating expenses.
The EBITDA margin was stable year-on-year due principally to higher
handset revenues.
UK
Service revenue declined 0.3%* for the year (Q3: -0.7%*; Q4: -0.1%*),
with improving trends in xed line offset by a slowdown in mobile,
reecting operational challenges following a billing system migration.
Q4 growth beneted from strong carrier services activity; excluding
this, underlying trends were stable. The organic growth rate for the year
excludes one-off settlements with other network operators in Q2.
Mobile service revenue declined 0.7%*. Contract customer growth
slowed in Q4, impacted partly by higher churn in relation to the
billing system migration. Revenue trends were also impacted by the
pricing and usage of 08XX numbers following the introduction
of Non-Geographic Call Services regulation, and a focus on giving
customers more control of their out-of-bundle data spend. As a result,
in-bundle revenue and demand for data add-ons continued to grow.
Enterprise mobile trends remained relatively stable despite increased
competition. National 4G coverage reached 91% (based on the OFCOM
denition), and 99.5% in London; based on our estimations, 4G coverage
was 84%, and despite some delays the pace of 4G coverage expansion
in conjunction with our network sharing partner is now accelerating.
We achieved signicant growth in 4G customers, with 7.0 million at the
period end (September 2015: 5.3 million).
Fixed service revenue grew 1.1%*. Excluding carrier services, xed
service revenue grew 2.4%* in the second half of the year including
an improving performance in Enterprise. After regional trials during
the summer, we began to offer our consumer broadband service
to 24 million premises across the UK (98% of BT’s bre footprint)
in October, securing 38,000 customers by 31 March 2016. Our new
TV service is in eld trials with plans to launch later in the current
calendar year.
EBITDA grew 1.2%*, with a 0.2* percentage point increase in the EBITDA
margin driven by continued operational efciencies. Reported EBITDA
beneted from one-off settlements with other network operators in the
rst half of the year.
Spain
Service revenue declined 3.5%* (Q3: -3.1%*; Q4: -3.2%*), with
mobile revenue recovering steadily despite the negative effect
of handset nancing, and continued positive momentum in xed.
Excluding handset nancing effects, service revenues declined
by0.3%* in the year.
Mobile service revenue fell 8.0%*. The contract customer base
continued to grow in a more stable market, despite increased
promotional activity around the start of the new football season. We are
seeing signs that ARPU is beginning to stabilise, aided by our market-
leading NPS scores in mobile and our ‘more-for-more’ pricing strategy,
in which customers receive higher data allowances and additional
features (e.g. free European roaming) together with an increase in the
monthly tariff. Our 4G population coverage reached 91% at 31 March
2016 and we have 5.4 million 4G customers.
Fixed service revenue rose 7.8%*, supported by consistent growth
in broadband net additions. The integration of Ono has proceeded
successfully and we have already achieved 100% of the original
€240 million of cost and capex synergies targeted. We now expect
to be able to deliver €300 million of annualised run-rate savings over the
original timeframe. In part this reects the very successful launch in May
of Vodafone One, our fully integrated cable, mobile and TV service,
which has already reached 1.5 million customers. Including our joint
bre network build with Orange, we now reach 8.5 million premises
with cable or bre. Our recent agreement with Mediapro together with
the wholesale obligations imposed on the incumbent provide us with
access to a full range of premium TV channels for the coming years,
albeit at an increased cost.
EBITDA increased 4.2%* year-on-year with a 1.3* percentage point
increase in the EBITDA margin, as strong cost control, the benet
to margin from handset nancing and the cost synergies from the Ono
acquisition more than offset rising TV costs.
Other Europe
Service revenue rose 1.5%* (Q3: 1.6%*; Q4: 2.1%*), with all markets
except Greece achieving growth during the year. In Q4, Romania (7.7%*),
Portugal (3.5%*) and the Czech Republic enjoyed an improvement
in top-line growth.
Overview Strategy review Performance Governance Financials Additional information
Vodafone Group Plc
Annual Report 2016
33