Vodafone 2016 Annual Report Download - page 137
Download and view the complete annual report
Please find page 137 of the 2016 Vodafone annual report below. You can navigate through the pages in the report by either clicking on the pages listed below, or by using the keyword search tool below to find specific information within the annual report.-
 1
1 -
2
-
3
-
4
-
5
-
6
-
7
-
8
-
9
-
10
-
11
-
12
-
13
-
14
-
15
-
16
-
17
-
18
-
19
-
20
-
21
-
22
-
23
-
24
-
25
-
26
-
27
-
28
-
29
-
30
-
31
-
32
-
33
-
34
-
35
-
36
-
37
-
38
-
39
-
40
-
41
-
42
-
43
-
44
-
45
-
46
-
47
-
48
-
49
-
50
-
51
-
52
-
53
-
54
-
55
-
56
-
57
-
58
-
59
-
60
-
61
-
62
-
63
-
64
-
65
-
66
-
67
-
68
-
69
-
70
-
71
-
72
-
73
-
74
-
75
-
76
-
77
-
78
-
79
-
80
-
81
-
82
-
83
-
84
-
85
-
86
-
87
-
88
-
89
-
90
-
91
-
92
-
93
-
94
-
95
-
96
-
97
-
98
-
99
-
100
-
101
-
102
-
103
-
104
-
105
-
106
-
107
-
108
-
109
-
110
-
111
-
112
-
113
-
114
-
115
-
116
-
117
-
118
-
119
-
120
-
121
-
122
-
123
-
124
-
125
-
126
-
 127
127 -
 128
128 -
 129
129 -
 130
130 -
 131
131 -
 132
132 -
 133
133 -
 134
134 -
 135
135 -
 136
136 -
 137
137 -
 138
138 -
 139
139 -
 140
140 -
 141
141 -
 142
142 -
 143
143 -
 144
144 -
 145
145 -
 146
146 -
 147
147 -
148
-
149
-
150
-
151
-
152
-
153
-
154
-
155
-
156
-
157
-
158
-
159
-
160
-
161
-
162
-
163
-
164
-
165
-
166
-
167
-
168
-
169
-
170
-
171
-
172
-
173
-
174
-
175
-
176
-
177
-
178
-
179
-
180
-
181
-
182
-
183
-
184
-
185
-
186
-
187
-
188
-
189
-
190
-
191
-
192
-
193
-
194
-
195
-
196
-
197
-
198
-
199
-
200
-
201
-
202
-
203
-
204
-
205
-
206
-
207
-
208
 |
 |
Overview Strategy review Performance Governance Financials Additional information
Vodafone Group Plc
Annual Report 2016
135
Net investment hedges
Exchange differences arising from the translation of the net investment in foreign operations are recognised directly in equity. Gains and losses
on those hedging instruments (which include bonds, commercial paper, cross currency swaps and foreign exchange contracts) designated
as hedges of the net investments in foreign operations are recognised in equity to the extent that the hedging relationship is effective; these
amounts are included in exchange differences on translation of foreign operations as stated in the statement of comprehensive income. Gains and
losses relating to hedge ineffectiveness are recognised immediately in the income statement for the period. Gains and losses accumulated in the
translation reserve are included in the income statement when the foreign operation is disposed of.
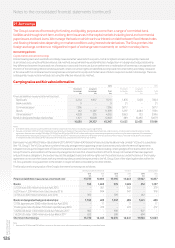
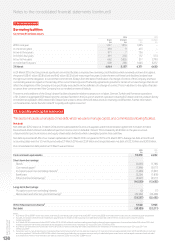
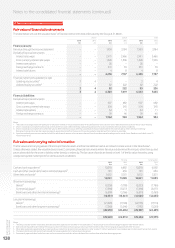
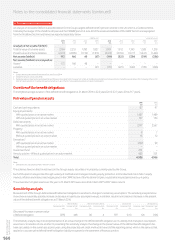
Capital management
The following table summarises the capital of the Group at 31 March:
2016 2015
£m £m
Financial assets:
Cash and cash equivalents (10,218) (6,882)
Fair value through the income statement (held for trading) (4,160) (5,513)
Loans and receivables (1,570) –
Derivative instruments in designated hedge relationships (1,774) (1,376)
Financial liabilities:
Fair value through the income statements (held for trading) 1,355 958
Derivative instruments in designated hedge relationships 209 26
Financial liabilities held at amortised cost 45,347 35,058
Net debt 29,189 22,271
Equity 67,317 67,733
Capital 96,506 90,004
The Group’s policy is to borrow centrally using a mixture of long-term and short-term capital market issues and borrowing facilities to meet
anticipated funding requirements. These borrowings, together with cash generated from operations, are loaned internally or contributed as equity
to certain subsidiaries. The Board has approved three internal debt protection ratios being: net interest to operating cash ow (plus dividends from
associates); retained cash ow (operating cash ow plus dividends from associates less interest, tax, dividends to non-controlling shareholders and
equity dividends) to net debt; and operating cash ow (plus dividends from associates) to net debt. These internal ratios establish levels of debt that
the Group should not exceed other than for relatively short periods of time and are shared with the Group’s debt rating agencies being Moody’s,
FitchRatings and Standard & Poor’s.
Financial risk management
The Group’s treasury function provides a centralised service to the Group for funding, foreign exchange, interest rate management and counterparty
risk management.
Treasury operations are conducted within a framework of policies and guidelines authorised and reviewed by the Board, most recently
on 3 November 2015. A treasury risk committee comprising the Group’s Chief Financial Ofcer, Group General Counsel and Company Secretary,
Group Financial Controller, Group Treasury Director and Director of Financial Reporting meets three times a year to review treasury activities and
its members receive management information relating to treasury activities on a quarterly basis. The Group’s accounting function, which does not
report to the Group Treasury Director, provides regular update reports of treasury activity to the Board. The Group’s internal auditor reviews the
internal control environment regularly.
The Group uses a number of derivative instruments for currency and interest rate risk management purposes only that are transacted by specialist
treasury personnel. The Group mitigates banking sector credit risk by the use of collateral support agreements.
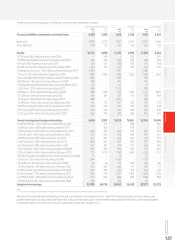
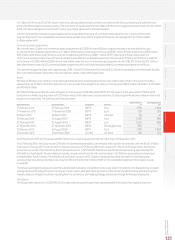
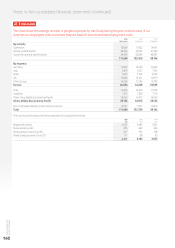
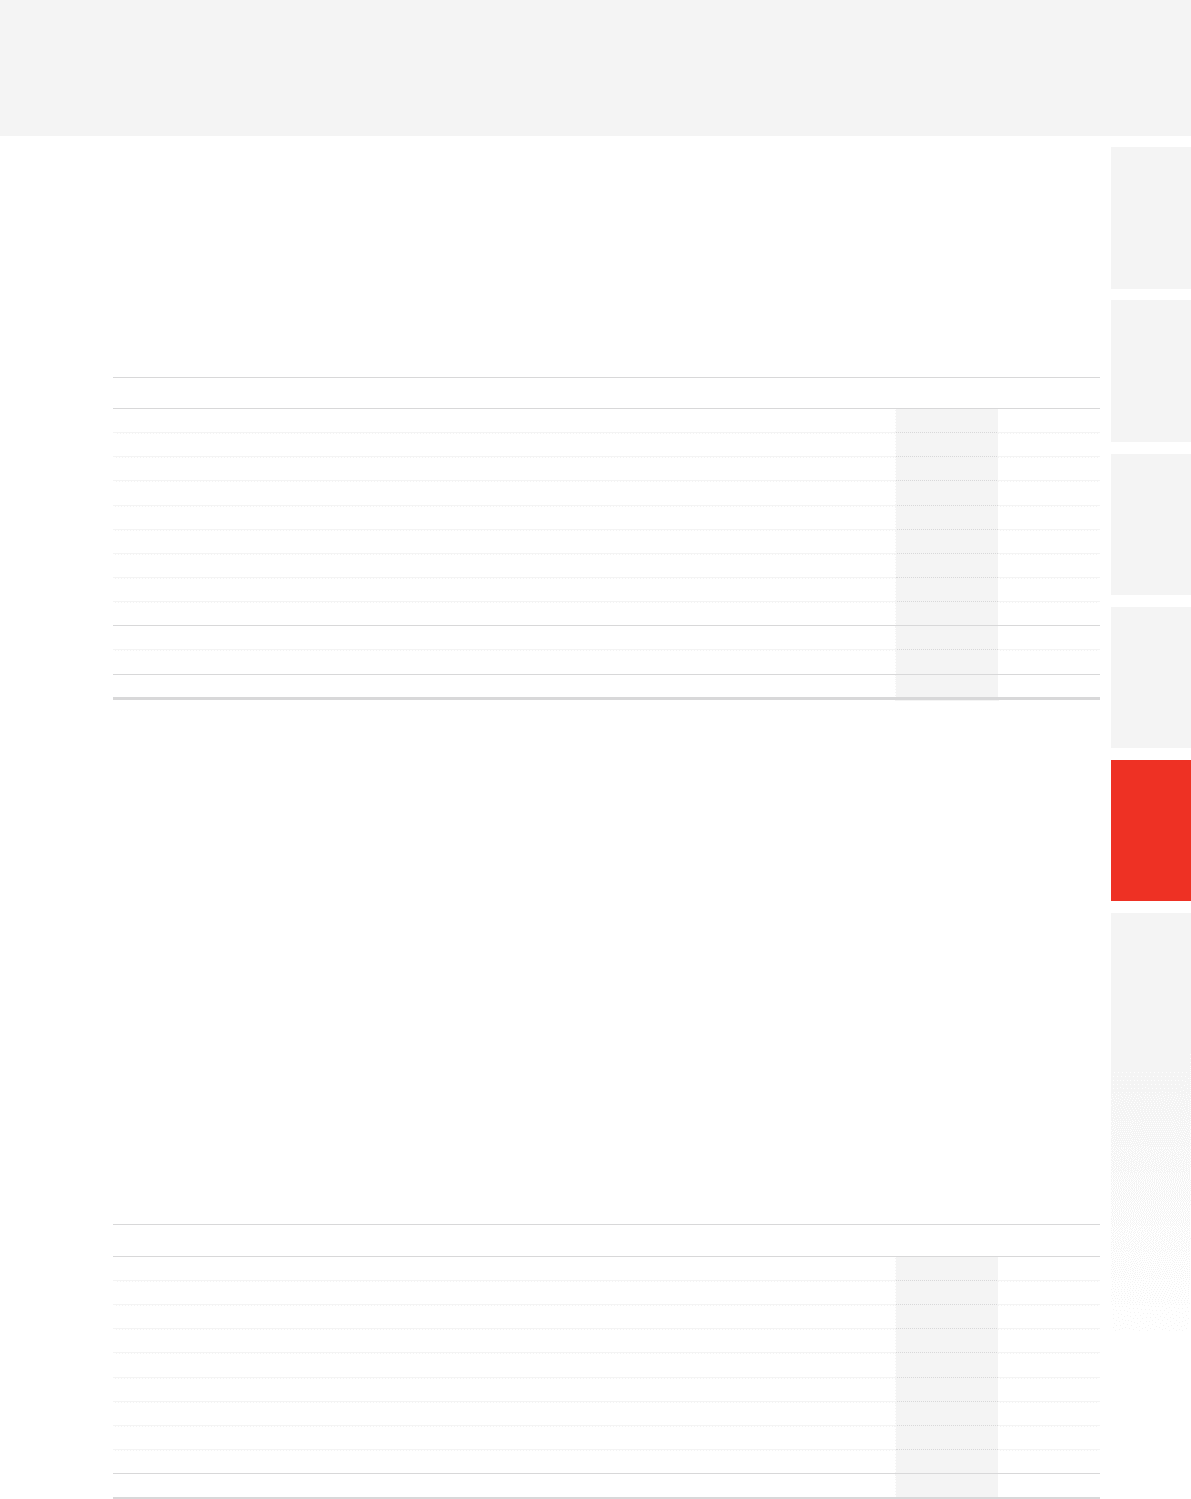
Credit risk
The Group considers its exposure to credit risk at 31 March to be as follows:
2016 2015
£m £m
Bank deposits 1,737 2,379
Repurchase agreements 2,700 2,000
Cash held in restricted deposits 791 650
UK government bonds 659 830
Money market fund investments 5,781 2,402
Derivative nancial instruments 4,304 4,005
Other investments – debt and bonds 6,347 5,906
Trade receivables 4,772 4,232
Other receivables and accrued income 3,206 2,959
30,297 25,363