Vodafone 2016 Annual Report Download - page 111
Download and view the complete annual report
Please find page 111 of the 2016 Vodafone annual report below. You can navigate through the pages in the report by either clicking on the pages listed below, or by using the keyword search tool below to find specific information within the annual report.-
 1
1 -
2
-
3
-
4
-
5
-
6
-
7
-
8
-
9
-
10
-
11
-
12
-
13
-
14
-
15
-
16
-
17
-
18
-
19
-
20
-
21
-
22
-
23
-
24
-
25
-
26
-
27
-
28
-
29
-
30
-
31
-
32
-
33
-
34
-
35
-
36
-
37
-
38
-
39
-
40
-
41
-
42
-
43
-
44
-
45
-
46
-
47
-
48
-
49
-
50
-
51
-
52
-
53
-
54
-
55
-
56
-
57
-
58
-
59
-
60
-
61
-
62
-
63
-
64
-
65
-
66
-
67
-
68
-
69
-
70
-
71
-
72
-
73
-
74
-
75
-
76
-
77
-
78
-
79
-
80
-
81
-
82
-
83
-
84
-
85
-
86
-
87
-
88
-
89
-
90
-
91
-
92
-
93
-
94
-
95
-
96
-
97
-
98
-
99
-
100
-
 101
101 -
 102
102 -
 103
103 -
 104
104 -
 105
105 -
 106
106 -
 107
107 -
 108
108 -
 109
109 -
 110
110 -
 111
111 -
 112
112 -
 113
113 -
 114
114 -
 115
115 -
 116
116 -
 117
117 -
 118
118 -
 119
119 -
 120
120 -
 121
121 -
122
-
123
-
124
-
125
-
126
-
127
-
128
-
129
-
130
-
131
-
132
-
133
-
134
-
135
-
136
-
137
-
138
-
139
-
140
-
141
-
142
-
143
-
144
-
145
-
146
-
147
-
148
-
149
-
150
-
151
-
152
-
153
-
154
-
155
-
156
-
157
-
158
-
159
-
160
-
161
-
162
-
163
-
164
-
165
-
166
-
167
-
168
-
169
-
170
-
171
-
172
-
173
-
174
-
175
-
176
-
177
-
178
-
179
-
180
-
181
-
182
-
183
-
184
-
185
-
186
-
187
-
188
-
189
-
190
-
191
-
192
-
193
-
194
-
195
-
196
-
197
-
198
-
199
-
200
-
201
-
202
-
203
-
204
-
205
-
206
-
207
-
208
 |
 |

Overview Strategy review Performance Governance Financials Additional information
Vodafone Group Plc
Annual Report 2016
109
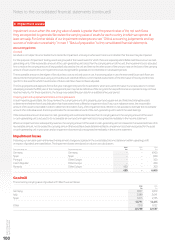
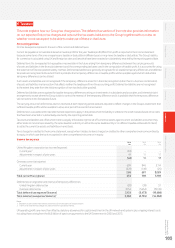
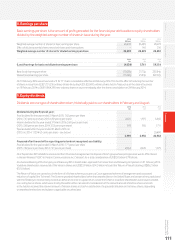
Other tax losses
The Group has losses amounting to £6,724 million (2015: £6,735 million) in respect of UK subsidiaries which are only available for offset against
future capital gains and since it is uncertain whether these losses will be utilised, no deferred tax asset has been recognised, in line with the prior year.
The remaining losses relate to a number of other jurisdictions across the Group. There are also £384 million (2015: £310 million) of unrecognised
other temporary differences.
The Group holds a deferred tax liability of £53 million (2015: £40 million) in respect of deferred taxation that would arise if temporary differences
on investments in subsidiaries, associates and interests in joint ventures were to be realised after the balance sheet date (see table above).
No deferred tax liability has been recognised in respect of a further £14,106 million (2015: £14,925 million) of unremitted earnings of subsidiaries,
associates and joint ventures because the Group is in a position to control the timing of the reversal of the temporary difference and it is probable
that such differences will not reverse in the foreseeable future. It is not practicable to estimate the amount of unrecognised deferred tax liabilities
in respect of these unremitted earnings.
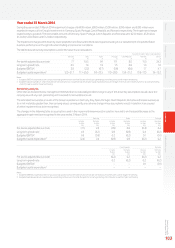
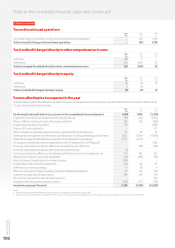
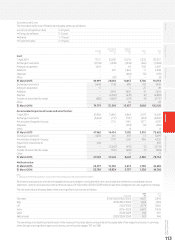
7. Discontinued operations and assets held for sale
Discontinued operations
On 21 February 2014 we completed the sale of our US group whose principal asset was its 45% interest in Verizon Wireless. The results of these
discontinued operations are detailed below.
Income statement and segment analysis of discontinued operations
2016 2015 2014
£m £m £m
Share of result in associates – – 3,191
Net nancing income – – 27
Prot before taxation – – 3,218
Taxation relating to performance of discontinued operations –57 (1,709)
Post-tax prot from discontinued operations –57 1,509
Gain on disposal of discontinued operations
2016 2015 2014
£m £m £m
Gain on disposal of discontinued operations before taxation (see note 28) – – 44,996
Other items arising from the disposal1– – 1,603
Net gain on disposal of discontinued operations – – 46,599
Note:
1 Includes dividends received from Verizon Wireless after the date of the announcement of the disposal.
Prot for the nancial year from discontinued operations
2016 2015 2014
£m £m £m
Prot for the nancial year from discontinued operations –57 1,509
Net gain on disposal of discontinued operations – – 46,599
Prot for the nancial year from discontinued operations –57 48,108
Earnings per share from discontinued operations
2016 2015 2014
Pence per share Pence per share Pence per share
– Basic –0.22p 181.74p
– Diluted –0.21p 180.30p
Total comprehensive income for the nancial year from discontinued operations
2016 2015 2014
£m £m £m
Attributable to owners of the parent –57 48,108
Cash ows from discontinued operations1
2016 2015 2014
£m £m £m
Net cash ows from operating activities – – (2,617)
Net cash ows from investing activities – – 4,830
Net cash ows from nancing activities – – (2,225)
Net decrease in cash and cash equivalents – – (12)
Cash and cash equivalents at the beginning of the nancial year –––
Exchange gain on cash and cash equivalents – – 12
Cash and cash equivalents at the end of the nancial year – – –
Note:
1 During the year ended 31 March 2015, the Group received a nal tax distribution from Verizon Wireless of £359 million and a taxation refund of £84 million in relation to our disposed US Group.