Vodafone 2016 Annual Report Download - page 163
Download and view the complete annual report
Please find page 163 of the 2016 Vodafone annual report below. You can navigate through the pages in the report by either clicking on the pages listed below, or by using the keyword search tool below to find specific information within the annual report.-
 1
1 -
2
-
3
-
4
-
5
-
6
-
7
-
8
-
9
-
10
-
11
-
12
-
13
-
14
-
15
-
16
-
17
-
18
-
19
-
20
-
21
-
22
-
23
-
24
-
25
-
26
-
27
-
28
-
29
-
30
-
31
-
32
-
33
-
34
-
35
-
36
-
37
-
38
-
39
-
40
-
41
-
42
-
43
-
44
-
45
-
46
-
47
-
48
-
49
-
50
-
51
-
52
-
53
-
54
-
55
-
56
-
57
-
58
-
59
-
60
-
61
-
62
-
63
-
64
-
65
-
66
-
67
-
68
-
69
-
70
-
71
-
72
-
73
-
74
-
75
-
76
-
77
-
78
-
79
-
80
-
81
-
82
-
83
-
84
-
85
-
86
-
87
-
88
-
89
-
90
-
91
-
92
-
93
-
94
-
95
-
96
-
97
-
98
-
99
-
100
-
101
-
102
-
103
-
104
-
105
-
106
-
107
-
108
-
109
-
110
-
111
-
112
-
113
-
114
-
115
-
116
-
117
-
118
-
119
-
120
-
121
-
122
-
123
-
124
-
125
-
126
-
127
-
128
-
129
-
130
-
131
-
132
-
133
-
134
-
135
-
136
-
137
-
138
-
139
-
140
-
141
-
142
-
143
-
144
-
145
-
146
-
147
-
148
-
149
-
150
-
151
-
152
-
 153
153 -
 154
154 -
 155
155 -
 156
156 -
 157
157 -
 158
158 -
 159
159 -
 160
160 -
 161
161 -
 162
162 -
 163
163 -
 164
164 -
 165
165 -
 166
166 -
 167
167 -
 168
168 -
 169
169 -
 170
170 -
 171
171 -
 172
172 -
 173
173 -
174
-
175
-
176
-
177
-
178
-
179
-
180
-
181
-
182
-
183
-
184
-
185
-
186
-
187
-
188
-
189
-
190
-
191
-
192
-
193
-
194
-
195
-
196
-
197
-
198
-
199
-
200
-
201
-
202
-
203
-
204
-
205
-
206
-
207
-
208
 |
 |

Overview Strategy review Performance Governance Financials Additional information
Vodafone Group Plc
Annual Report 2016
161
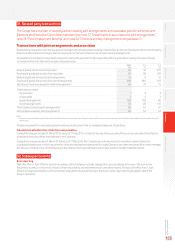
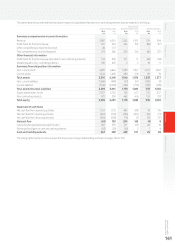
The table below shows selected nancial data in respect of subsidiaries that have non-controlling interests that are material to the Group.
Vodacom Group Limited
Vodafone Egypt
Telecommunications S.A.E. Vodafone Qatar Q.S.C.
2016
£m
2015
£m
2016
£m
2015
£m
2016
£m
2015
£m
Summary comprehensive income information
Revenue 3,887 4,341 1,202 1,191 374 394
Prot/(loss) for the nancial year 551 603 224 156 (86) (37)
Other comprehensive expense/(income) 28 (17) – – – –
Total comprehensive income/(expense) 579 586 224 156 (86) (37)
Other nancial information
Prot/(loss) for the nancial year allocated to non-controlling interests 193 205 101 71 (66) (29)
Dividends paid to non-controlling interests 196 229 2 2 16 11
Summary nancial position information
Non-current assets 4,287 4,844 1,250 1,357 1,237 1,301
Current assets 1,304 1,405 690 518 96 76
Total assets 5,591 6,249 1,940 1,875 1,333 1,377
Non-current liabilities (1,586) (490) (61) (57) (205) (8)
Current liabilities (1,196) (2,478) (709) (729) (189) (339)
Total assets less total liabilities 2,809 3,281 1,170 1,089 939 1,030
Equity shareholders’ funds 2,337 2,722 708 673 215 237
Non-controlling interests 472 559 462 416 724 793
Total equity 2,809 3,281 1,170 1,089 939 1,030
Statement of cash ows
Net cash ow from operating activities 1,154 1,215 485 438 76 96
Net cash ow from investing activities (632) (733) (235) (267) (65) (71)
Net cash ow from nancing activities (584) (300) (16) (3) (15) (17)
Net cash ow (62) 182 234 168 (4) 8
Cash and cash equivalents brought forward 492 330 311 138 28 16
Exchange (loss)/gain on cash and cash equivalents (63) (20) (56) 514
Cash and Cash Equivalents 367 492 489 311 25 28
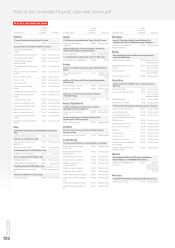
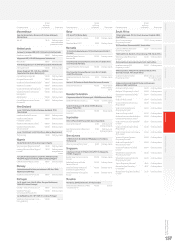
The voting rights held by the Group equal the Group’s percentage shareholding as shown on pages 154 to 160.