Vodafone 2016 Annual Report Download - page 196
Download and view the complete annual report
Please find page 196 of the 2016 Vodafone annual report below. You can navigate through the pages in the report by either clicking on the pages listed below, or by using the keyword search tool below to find specific information within the annual report.-
 1
1 -
2
-
3
-
4
-
5
-
6
-
7
-
8
-
9
-
10
-
11
-
12
-
13
-
14
-
15
-
16
-
17
-
18
-
19
-
20
-
21
-
22
-
23
-
24
-
25
-
26
-
27
-
28
-
29
-
30
-
31
-
32
-
33
-
34
-
35
-
36
-
37
-
38
-
39
-
40
-
41
-
42
-
43
-
44
-
45
-
46
-
47
-
48
-
49
-
50
-
51
-
52
-
53
-
54
-
55
-
56
-
57
-
58
-
59
-
60
-
61
-
62
-
63
-
64
-
65
-
66
-
67
-
68
-
69
-
70
-
71
-
72
-
73
-
74
-
75
-
76
-
77
-
78
-
79
-
80
-
81
-
82
-
83
-
84
-
85
-
86
-
87
-
88
-
89
-
90
-
91
-
92
-
93
-
94
-
95
-
96
-
97
-
98
-
99
-
100
-
101
-
102
-
103
-
104
-
105
-
106
-
107
-
108
-
109
-
110
-
111
-
112
-
113
-
114
-
115
-
116
-
117
-
118
-
119
-
120
-
121
-
122
-
123
-
124
-
125
-
126
-
127
-
128
-
129
-
130
-
131
-
132
-
133
-
134
-
135
-
136
-
137
-
138
-
139
-
140
-
141
-
142
-
143
-
144
-
145
-
146
-
147
-
148
-
149
-
150
-
151
-
152
-
153
-
154
-
155
-
156
-
157
-
158
-
159
-
160
-
161
-
162
-
163
-
164
-
165
-
166
-
167
-
168
-
169
-
170
-
171
-
172
-
173
-
174
-
175
-
176
-
177
-
178
-
179
-
180
-
181
-
182
-
183
-
184
-
185
-
 186
186 -
 187
187 -
 188
188 -
 189
189 -
 190
190 -
 191
191 -
 192
192 -
 193
193 -
 194
194 -
 195
195 -
 196
196 -
 197
197 -
 198
198 -
 199
199 -
 200
200 -
 201
201 -
 202
202 -
 203
203 -
 204
204 -
 205
205 -
 206
206 -
207
-
208
 |
 |

Vodafone Group Plc
Annual Report 2016
194
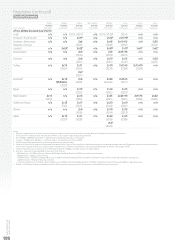
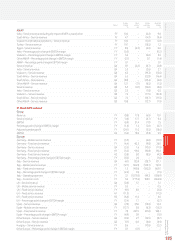
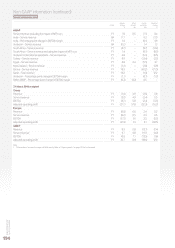
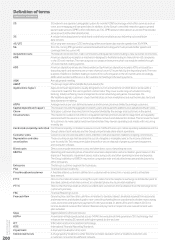
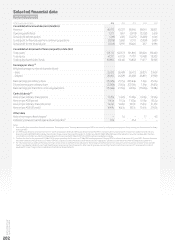
Non-GAAP information (continued)
Unaudited information
Period
Organic
change
%
Other
activity1
pps
Foreign
exchange
pps
Reported
change
%
AMAP
Service revenue excluding the impact of MTR cuts FY 7. 0 0.5 (7.1) 0.4
India – Service revenue Q4 11. 7 –9.3 21.0
India – Percentage point change in EBITDA margin FY 1.0 –(0.1) 0.9
Vodacom – Service revenue Q4 (0.2) –1.4 1.2
South Africa – Service revenue FY (2.7) –(9.7) (12.4)
South Africa – Service revenue excluding the impact of MTR cuts FY 1.4 –(9.7) (8.3)
Vodacom’s international operations – Service revenue FY 4.8 –(5.3) (0.5)
Turkey – Service revenue FY 9.9 –(13.4) (3.5)
Egypt – Service revenue FY 2.8 6.4 (5.5) 3.7
New Zealand – Service revenue FY (3.1) –(2.8) (5.9)
Ghana – Service revenue FY 18.9 –(40.2) (21.3)
Qatar – Total revenue FY 13. 2 –(1.0) 12. 2
Vodacom – Percentage point change in EBITDA margin FY (1.1) –(0.1) (1.2)
Other AMAP – Percentage point change in EBITDA margin FY (0.3) (0.2) 0.5 –
31 March 2014 restated
Group
Revenue FY (1.6) 4.9 (2.5) 0.8
Service revenue FY (2.0) 4.9 (2.4) 0.5
EBITDA FY (6.7) 5.8 (2.4) (3.3)
Adjusted operating prot FY (21.7) 5 7. 8 (52.3) (16.2)
Europe
Revenue FY (8.8) 6.6 2.4 0.2
Service revenue FY (8.2) 6.5 2.3 0.6
EBITDA FY (17.1) 9.1 2.5 (5.5)
Adjusted operating prot FY (41.9) 1.3 2 .1 (38.5)
AMAP
Revenue FY 8.9 0.8 (12.1) (2.4)
Service revenue FY 6.7 0.8 (11.7) (4.2)
EBITDA FY 10.8 1.1 (13.5) (1.6)
Adjusted operating prot FY 30.7 (0.1) (18.6) 12. 0
Note:
1 “Other activity” includes the impact of M&A activity. Refer to “Organic growth” on page 191 for further detail.