Vodafone 2016 Annual Report Download - page 191
Download and view the complete annual report
Please find page 191 of the 2016 Vodafone annual report below. You can navigate through the pages in the report by either clicking on the pages listed below, or by using the keyword search tool below to find specific information within the annual report.-
 1
1 -
2
-
3
-
4
-
5
-
6
-
7
-
8
-
9
-
10
-
11
-
12
-
13
-
14
-
15
-
16
-
17
-
18
-
19
-
20
-
21
-
22
-
23
-
24
-
25
-
26
-
27
-
28
-
29
-
30
-
31
-
32
-
33
-
34
-
35
-
36
-
37
-
38
-
39
-
40
-
41
-
42
-
43
-
44
-
45
-
46
-
47
-
48
-
49
-
50
-
51
-
52
-
53
-
54
-
55
-
56
-
57
-
58
-
59
-
60
-
61
-
62
-
63
-
64
-
65
-
66
-
67
-
68
-
69
-
70
-
71
-
72
-
73
-
74
-
75
-
76
-
77
-
78
-
79
-
80
-
81
-
82
-
83
-
84
-
85
-
86
-
87
-
88
-
89
-
90
-
91
-
92
-
93
-
94
-
95
-
96
-
97
-
98
-
99
-
100
-
101
-
102
-
103
-
104
-
105
-
106
-
107
-
108
-
109
-
110
-
111
-
112
-
113
-
114
-
115
-
116
-
117
-
118
-
119
-
120
-
121
-
122
-
123
-
124
-
125
-
126
-
127
-
128
-
129
-
130
-
131
-
132
-
133
-
134
-
135
-
136
-
137
-
138
-
139
-
140
-
141
-
142
-
143
-
144
-
145
-
146
-
147
-
148
-
149
-
150
-
151
-
152
-
153
-
154
-
155
-
156
-
157
-
158
-
159
-
160
-
161
-
162
-
163
-
164
-
165
-
166
-
167
-
168
-
169
-
170
-
171
-
172
-
173
-
174
-
175
-
176
-
177
-
178
-
179
-
180
-
 181
181 -
 182
182 -
 183
183 -
 184
184 -
 185
185 -
 186
186 -
 187
187 -
 188
188 -
 189
189 -
 190
190 -
 191
191 -
 192
192 -
 193
193 -
 194
194 -
 195
195 -
 196
196 -
 197
197 -
 198
198 -
 199
199 -
 200
200 -
 201
201 -
202
-
203
-
204
-
205
-
206
-
207
-
208
 |
 |

Overview Strategy review Performance Governance Financials
Additional
information
Vodafone Group Plc
Annual Report 2016
189
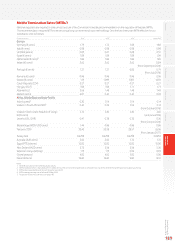
Mobile Termination Rates (‘MTRs’)
National regulators are required to take utmost account of the Commission’s existing recommendation on the regulation of xed and MTRs.
This recommendation requires MTRs to be set using a long run incremental cost methodology. Over the last three years MTRs effective for our
subsidiaries were as follows:
Country by region 20141 20151201611 April 20162
Europe
Germany (€ cents) 1.79 1.72 1.66 1.66
Italy (€ cents) 0.98 0.98 0.98 0.98
UK (GB £ pence) 0.85 0.67 0.68 0.51
Spain (€ cents) 1.09 1.09 1.09 1.09
Netherlands (€ cents)31.86 1.86 1.86 1.86
Ireland (€ cents) 2.60 2.60 2.60 0.84
(from September 2016)
Portugal (€ cents) 1.27 1.27 0.83 0.79
(from July 2016)
Romania (€ cents) 0.96 0.96 0.96 0.96
Greece (€ cents) 1.19 1.099 1.081 1.081
Czech Republic (CZK) 0.27 0.27 0.27 0.27
Hungary (HUF) 7.06 7.06 1.71 1.71
Albania (ALL) 2.66 1.48 1.48 1.48
Malta (€ cents) 2.07 0.40 0.40 0.40
Africa, Middle East and Asia-Pacic
India (rupees)40.20 0.14 0 .14 0.14
Vodacom: South Africa (ZAR)50.40 0.20 0 .16 0.13
(from October 2016)
Vodacom: Democratic Republic of Congo
(USD cents)
3.70 3.40 3.40 3.40
(until June 2016)
Lesotho (LSL/ZAR) 0.47 0.38 0.32 0.26
(from October 2016)
Mozambique (MZN/USD cents) 1.44 0.86 0.86 0.86
Tanzania (TZN) 32.40 30.58 28.57 26.96
(from January 2017)
Turkey (lira) 0.0258 0.0258 0.0258 0.0258
Australia (AUD cents) 3.60 3.60 1.70 1.70
Egypt (PTS/piastres) 10.00 10.00 10.00 10.00
New Zealand (NZD cents) 3.72 3.56 3.56 3.56
Safaricom: Kenya (shilling) 1.15 1.15 0.99 0.99
Ghana (peswas) 4.00 4.00 5.00 5.00
Qatar (dirhams) 16.60 16.60 9.00 8.31
Notes:
1 All MTRs are based on end of nancial year values.
2 MTRs established from 1 April 2016 are included at the current rate or where a glide-path or a nal decision has been determined by the national regulatory authority.
3 MTR under review by ECJ and decision due after June 2016.
4 MTR under appeal and due to be heard 18 May 2016.
5 Please see Vodacom: South Africa on page 185.