Vodafone 2016 Annual Report Download - page 126
Download and view the complete annual report
Please find page 126 of the 2016 Vodafone annual report below. You can navigate through the pages in the report by either clicking on the pages listed below, or by using the keyword search tool below to find specific information within the annual report.-
 1
1 -
2
-
3
-
4
-
5
-
6
-
7
-
8
-
9
-
10
-
11
-
12
-
13
-
14
-
15
-
16
-
17
-
18
-
19
-
20
-
21
-
22
-
23
-
24
-
25
-
26
-
27
-
28
-
29
-
30
-
31
-
32
-
33
-
34
-
35
-
36
-
37
-
38
-
39
-
40
-
41
-
42
-
43
-
44
-
45
-
46
-
47
-
48
-
49
-
50
-
51
-
52
-
53
-
54
-
55
-
56
-
57
-
58
-
59
-
60
-
61
-
62
-
63
-
64
-
65
-
66
-
67
-
68
-
69
-
70
-
71
-
72
-
73
-
74
-
75
-
76
-
77
-
78
-
79
-
80
-
81
-
82
-
83
-
84
-
85
-
86
-
87
-
88
-
89
-
90
-
91
-
92
-
93
-
94
-
95
-
96
-
97
-
98
-
99
-
100
-
101
-
102
-
103
-
104
-
105
-
106
-
107
-
108
-
109
-
110
-
111
-
112
-
113
-
114
-
115
-
 116
116 -
 117
117 -
 118
118 -
 119
119 -
 120
120 -
 121
121 -
 122
122 -
 123
123 -
 124
124 -
 125
125 -
 126
126 -
 127
127 -
 128
128 -
 129
129 -
 130
130 -
 131
131 -
 132
132 -
 133
133 -
 134
134 -
 135
135 -
 136
136 -
137
-
138
-
139
-
140
-
141
-
142
-
143
-
144
-
145
-
146
-
147
-
148
-
149
-
150
-
151
-
152
-
153
-
154
-
155
-
156
-
157
-
158
-
159
-
160
-
161
-
162
-
163
-
164
-
165
-
166
-
167
-
168
-
169
-
170
-
171
-
172
-
173
-
174
-
175
-
176
-
177
-
178
-
179
-
180
-
181
-
182
-
183
-
184
-
185
-
186
-
187
-
188
-
189
-
190
-
191
-
192
-
193
-
194
-
195
-
196
-
197
-
198
-
199
-
200
-
201
-
202
-
203
-
204
-
205
-
206
-
207
-
208
 |
 |

Vodafone Group Plc
Annual Report 2016
124
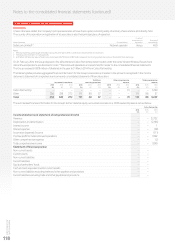
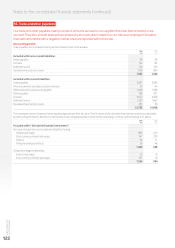
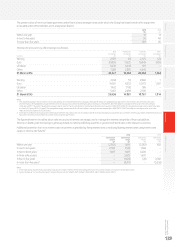
17. Provisions (continued)
Provisions have been analysed between current and non-current as follows:
31 March 2016
Asset
retirement Legal and
obligations regulatory Other Total
£m £m £m £m
Current liabilities 12 242 503 757
Non-current liabilities 439 719 122 1,280
451 961 625 2,037
31 March 2015
Asset
retirement Legal and
obligations regulatory Other Total
£m £m £m £m
Current liabilities 14 311 442 767
Non-current liabilities 452 523 107 1,082
466 834 549 1,849
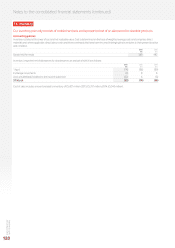
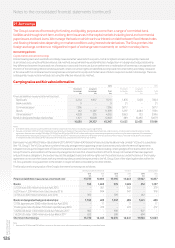
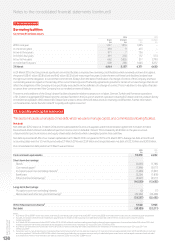
18. Called up share capital
Called up share capital is the number of shares in issue at their par value. A number of shares were allotted during
the year in relation to employee share schemes.
Accounting policies
Equity instruments issued by the Group are recorded at the amount of the proceeds received, net of direct issuance costs.
2016 2015
Number £m Number £m
Ordinary shares of 2020⁄21 US cents each allotted, issued and fully paid:1
1 April 28,812,787,098 3,792 28,811,923,128 3,792
Allotted during the year 608,910 –863,970 –
31 March 28,813,396,008 3,792 28,812,787,098 3,792
Note:
1 At 31 March 2016, the Group held 2,254,825,696 (2015: 2,300,749,013) treasury shares with a nominal value of £297 million (2015: £303 million). The market value of shares held was
£4,988 million (2015: £5,072 million). Duringthe year 45,923,317 (2015: 71,213,894) treasury shares were reissued under Group share schemes.
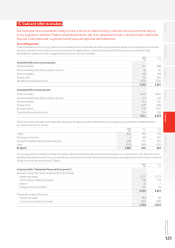
Allotted during the year
Nominal Net
value proceeds
Number £m £m
UK share awards – – –
US share awards 608,910 –1
Total share awards 608,910 –1
On 19 February 2016, we announced the placing of subordinated mandatory convertible bonds totalling £1.44 billion with an 18 months maturity
date due in 2017 and £1.44 billion with a 3 year maturity due in 2019. The bonds are convertible into a total of 1,325,356,650 ordinary shares with
a conversion price of £2.1730 per share. For further details see note 22 “Liquidity and capital resources”.
Notes to the consolidated nancial statements (continued)