Vodafone 2016 Annual Report Download - page 34
Download and view the complete annual report
Please find page 34 of the 2016 Vodafone annual report below. You can navigate through the pages in the report by either clicking on the pages listed below, or by using the keyword search tool below to find specific information within the annual report.-
 1
1 -
2
-
3
-
4
-
5
-
6
-
7
-
8
-
9
-
10
-
11
-
12
-
13
-
14
-
15
-
16
-
17
-
18
-
19
-
20
-
21
-
22
-
23
-
 24
24 -
 25
25 -
 26
26 -
 27
27 -
 28
28 -
 29
29 -
 30
30 -
 31
31 -
 32
32 -
 33
33 -
 34
34 -
 35
35 -
 36
36 -
 37
37 -
 38
38 -
 39
39 -
 40
40 -
 41
41 -
 42
42 -
 43
43 -
 44
44 -
45
-
46
-
47
-
48
-
49
-
50
-
51
-
52
-
53
-
54
-
55
-
56
-
57
-
58
-
59
-
60
-
61
-
62
-
63
-
64
-
65
-
66
-
67
-
68
-
69
-
70
-
71
-
72
-
73
-
74
-
75
-
76
-
77
-
78
-
79
-
80
-
81
-
82
-
83
-
84
-
85
-
86
-
87
-
88
-
89
-
90
-
91
-
92
-
93
-
94
-
95
-
96
-
97
-
98
-
99
-
100
-
101
-
102
-
103
-
104
-
105
-
106
-
107
-
108
-
109
-
110
-
111
-
112
-
113
-
114
-
115
-
116
-
117
-
118
-
119
-
120
-
121
-
122
-
123
-
124
-
125
-
126
-
127
-
128
-
129
-
130
-
131
-
132
-
133
-
134
-
135
-
136
-
137
-
138
-
139
-
140
-
141
-
142
-
143
-
144
-
145
-
146
-
147
-
148
-
149
-
150
-
151
-
152
-
153
-
154
-
155
-
156
-
157
-
158
-
159
-
160
-
161
-
162
-
163
-
164
-
165
-
166
-
167
-
168
-
169
-
170
-
171
-
172
-
173
-
174
-
175
-
176
-
177
-
178
-
179
-
180
-
181
-
182
-
183
-
184
-
185
-
186
-
187
-
188
-
189
-
190
-
191
-
192
-
193
-
194
-
195
-
196
-
197
-
198
-
199
-
200
-
201
-
202
-
203
-
204
-
205
-
206
-
207
-
208
 |
 |

Operating results (continued)
Europe1
Germany
£m
Italy
£m
UK
£m
Spain
£m
Other Europe
£m
Eliminations
£m
Europe
£m
Restated
2015
£m
% change
£Organic
Year ended 31 March 2016
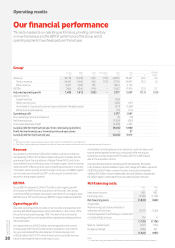
Revenue 7, 78 7 4,405 6 ,17 3 3,633 4,835 (115) 26,718 27,687 (3.5) 0.4
Service revenue 7,19 7 3,758 5,849 3,2 74 4,494 (111) 24,461 25,588 (4.4) (0.6)
Other revenue 590 647 324 359 341 (4) 2,257 2,099
EBITDA 2,537 1,478 1,289 915 1,467 –7,686 7,894 (2.6) 1.7
Adjusted operating prot 378 590 (69) 53 457 –1,409 1,733 (18.7) (12.9)
EBITDA margin 32.6% 33.6% 20.9% 25.2% 30.3% 28.8% 28.5%
Note:
1 The Group has amended its reporting to reect changes in the internal management of its Enterprise business. The primary change has been that on 1 April 2015 the Group redened its
segments to report international voice transit service revenue within Common Functions rather than within the service revenue amount disclosed for each country and region. The service
revenue amounts presented for the year ended 31 March 2015 have been restated onto a comparable basis together with all disclosed organic service revenue growth rates. There is no impact
on total Group service revenue or costs.
Revenue decreased 3.5% for the year. M&A activity, including HOL and
Cobra, contributed a 1.3 percentage point positive impact, while foreign
exchange movements contributed a 5.2 percentage point negative
impact. On an organic basis, service revenue decreased by 0.6%*,
reecting continued competitive pressures in a number of markets.
EBITDA decreased 2.6%, including a 1.2 percentage point positive
impact from M&A activity and a 5.5 percentage point negative impact
from foreign exchange movements. On an organic basis EBITDA
increased 1.7%* driven by good cost control in a number of our markets,
as well as the benets of acquisition integrations.
Organic
change
%
Other
activity1
pps
Foreign
exchange
pps
Reported
change
%
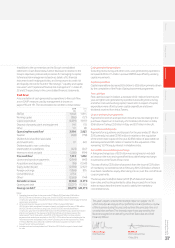
Revenue – Europe 0.4 1.3 (5.2) (3.5)
Service revenue
Germany (0.4) – (6.7) (7.1)
Italy (0.8) – (6.7) (7.5)
UK (0.3) (0.4) (0.1) (0.8)
Spain (3.5) 8.7 (6.6) (1.4)
Other Europe 1.5 1.9 (6.8) (3.4)
Europe (0.6) 1.3 (5.1) (4.4)
EBITDA
Germany 2 .1 – (6.7) (4.6)
Italy 3.1 – (6.8) (3.7)
UK 1.2 (5.4) – (4.2)
Spain 4.2 19.6 (6.8) 17. 0
Other Europe (1.5) 1.3 (6.5) (6.7)
Europe 1.7 1.2 (5.5) (2.6)
Europe adjusted
operating prot (12.9) (0.2) (5.6) (18.7)
Note:
1 “Other activity” includes the impact of M&A activity. Refer to “Organic growth” on page 191
for further detail.
Germany
Service revenue declined 0.4%* for the year, but returned to growth
in Q4 (Q3: -0.4%*; Q4: 1.6%*) led by improvements in consumer mobile
and xed trends and aided by an accounting reclassication in xed line.
Mobile service revenue declined 1.6%*. Consumer contract revenue
stabilised in the year, supported by consistent growth in contract
net adds (+594,000 for the year). This performance has been driven
by an increased focus on direct channels and our ‘Otelo’ second brand;
during Q4, higher competition in indirect channels weighed on our
contract net additions. The Enterprise market became increasingly
competitive during the year, leading to a deteriorating revenue trend
as falling ARPU more than offset good contract wins. We have made
further strong progress on network investment, with 87% 4G coverage
and dropped call rates declining 25% year-on-year to an all-time low
of 0.44%. In November, the independent “Connect” test conrmed the
premium quality of our voice network in Germany and a strong second
and most improved data position.
Fixed service revenue growth was 1.5%*, with continued strong growth
in cable and a slowing decline in DSL-related revenue. Cable net adds
growth continued to be strong throughout the year, supplemented
by ongoing migrations from the DSL base; in the second half of the
year DSL net adds also turned positive, with growing customer demand
for VDSL. Broadband ARPU was down year-on-year in a promotional
market, with improvements in cable offset by DSL declines, although
the pace of decline began to moderate during H2. The integration
of KDG has been completed; we expect cost synergies to meet the initial
targets set out at the time of acquisition, and now expect further upside
potential longer-term. In November, we launched Vodafone Red One,
our fully integrated xed, mobile and TV service combining high speed
mobile and xed; as of 31 March 2016 we had 54,000 customers.
EBITDA grew 2.1%*, with EBITDA margin improving by 0.8* percentage
points. The impact of lower revenues and increased Project Spring
network opex was more than offset by opex efciencies (including KDG
synergies), savings in commercial costs (aided by our increased focus
on direct channels) and a change in commission processes.
Vodafone Group Plc
Annual Report 2016
32