Vodafone 2016 Annual Report Download - page 133
Download and view the complete annual report
Please find page 133 of the 2016 Vodafone annual report below. You can navigate through the pages in the report by either clicking on the pages listed below, or by using the keyword search tool below to find specific information within the annual report.-
 1
1 -
2
-
3
-
4
-
5
-
6
-
7
-
8
-
9
-
10
-
11
-
12
-
13
-
14
-
15
-
16
-
17
-
18
-
19
-
20
-
21
-
22
-
23
-
24
-
25
-
26
-
27
-
28
-
29
-
30
-
31
-
32
-
33
-
34
-
35
-
36
-
37
-
38
-
39
-
40
-
41
-
42
-
43
-
44
-
45
-
46
-
47
-
48
-
49
-
50
-
51
-
52
-
53
-
54
-
55
-
56
-
57
-
58
-
59
-
60
-
61
-
62
-
63
-
64
-
65
-
66
-
67
-
68
-
69
-
70
-
71
-
72
-
73
-
74
-
75
-
76
-
77
-
78
-
79
-
80
-
81
-
82
-
83
-
84
-
85
-
86
-
87
-
88
-
89
-
90
-
91
-
92
-
93
-
94
-
95
-
96
-
97
-
98
-
99
-
100
-
101
-
102
-
103
-
104
-
105
-
106
-
107
-
108
-
109
-
110
-
111
-
112
-
113
-
114
-
115
-
116
-
117
-
118
-
119
-
120
-
121
-
122
-
 123
123 -
 124
124 -
 125
125 -
 126
126 -
 127
127 -
 128
128 -
 129
129 -
 130
130 -
 131
131 -
 132
132 -
 133
133 -
 134
134 -
 135
135 -
 136
136 -
 137
137 -
 138
138 -
 139
139 -
 140
140 -
 141
141 -
 142
142 -
 143
143 -
144
-
145
-
146
-
147
-
148
-
149
-
150
-
151
-
152
-
153
-
154
-
155
-
156
-
157
-
158
-
159
-
160
-
161
-
162
-
163
-
164
-
165
-
166
-
167
-
168
-
169
-
170
-
171
-
172
-
173
-
174
-
175
-
176
-
177
-
178
-
179
-
180
-
181
-
182
-
183
-
184
-
185
-
186
-
187
-
188
-
189
-
190
-
191
-
192
-
193
-
194
-
195
-
196
-
197
-
198
-
199
-
200
-
201
-
202
-
203
-
204
-
205
-
206
-
207
-
208
 |
 |
Overview Strategy review Performance Governance Financials Additional information
Vodafone Group Plc
Annual Report 2016
131
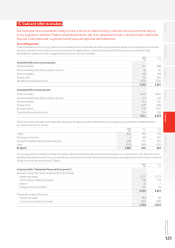
At 31 March 2016 we had £10,218 million of cash and cash equivalents which are held in accordance with the counterparty and settlement risk
limits of the Board approved treasurypolicy. The main forms of liquid investment at 31 March 2016 were managed investment funds, money market
funds, UK index linked government bonds, tri-party repurchase agreements and bankdeposits.
The cash received from collateral support agreements mainly reects the value of our interest rate swap and cross currency interest rate
swap portfolios which are substantially netpresent value positive. See note 23 “Capital and nancial risk management” for further details
on these agreements.
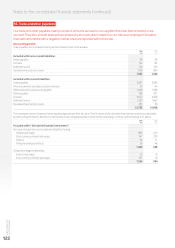
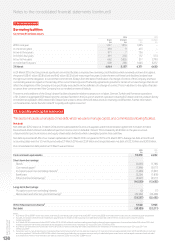
Commercial paper programmes
We currently have US and euro commercial paper programmes of US$15 billion and £8 billion respectively which are available to be used
to meet short-term liquidity requirements. At 31 March 2016 amounts external to the Group of €8,907 million (£7,043 million) and US$38 million
(£26 million) were drawn under the euro commercial paper programme and US$471 million (£327 million) were drawn down under the
US commercial paper programme, with such funds being provided by counterparties external to the Group. At 31 March 2015 amounts external
to the Group of €3,928 million (£2,839 million) were drawn under the euro commercial paper programme and US$3,321 million (£2,237 million)
were drawn down under the US commercial paper programme, with such funds being provided by counterparties external to the Group.
The commercial paper facilities were supported by US$4.1 billion (£2.8 billion) and €4.0 billion (£3.2 billion) of syndicated committed bank facilities
(see “Committed facilities” below). No amounts had been drawn under either bank facility.
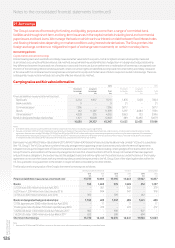
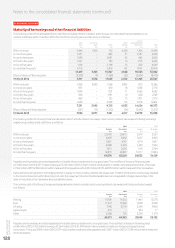
Bonds
We have a €30 billion euro medium-term note programme and a US shelf programme which are used to meet medium to long-term funding
requirements. At 31 March 2016 the total amounts in issue under these programmes split by currency were US$14.1 billion, £2.3 billion, €12.9 billion
and NOK 850 million.
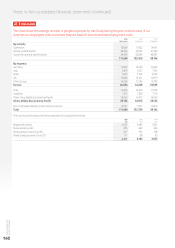
At 31 March 2016 we had bonds outstanding with a nominal value of £22,380 million (2015: £17,153 million). In the year ended 31 March 2016
bonds with a nominal value equivalent of £129 million and £5,450 million were issued under the US shelf programme and euro medium-term note
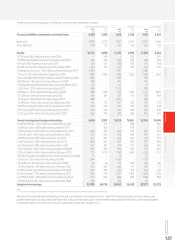
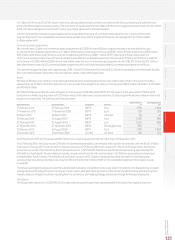
programme respectively. The bonds issued in the year were:
Nominal amount Sterling equivalent
Date of bond issue Maturity of bond Programme Currency m £m
25 February 2016 25 February 2019 EMTN Euro 1,750 1,384
17 November 2015 17 November 2020 EMTN Euro 750 593
30 March 2016 30 March 2021 EMTN US dollar 60 42
25 February 2016 25 August 2021 EMTN Euro 1,250 988
25 February 2016 25 August 2023 EMTN Euro 1,250 988
27 November 2015 27 November 2025 EMTN Norwegian krona 850 71
25 February 2016 25 August 2026 EMTN Euro 1,750 1,384
3 December 2015 3 December 2045 US shelf US dollar 186 129
On 26 November 2015, the Group issued £600 million zero-coupon equity linked bonds maturing on 26 November 2020.
On 25 February 2016, the Group issued £2.9 billion of subordinated mandatory convertible bonds issued in two tranches, with the rst £1.4 billion
maturing on 25 August 2017 and a further £1.4 billion maturing on 25 February 2019 with coupons of 1.5% and 2.0% respectively. At the initial
conversion price of £2.1730, at maturity the bonds will convert to 1, 325,356,650 Vodafone Group Plc shares representing approximately 5%
of Vodafone’s share capital. The mandatory bonds are compound instruments with nominal values of £2.8 billion recognised as a component
of shareholders’ funds in equity. The initial fair value of future coupons of £0.1 billion is recognised as a nancial liability in borrowings and
subsequently measured at amortised cost using the effective interest rate method. Refer to the consolidated statement of changes in equity
on page 89.
The Group has hedged its exposure under the subordinated mandatory convertible bonds to any future movements in its share price by an option
strategy designed to hedge the economic impact of share price movements during the term of the bonds. Should the Group decide to buy back
ordinary shares to mitigate the dilution resulting from the conversion, the hedging strategy will provide a hedge for the repurchase price.
Own shares
The Group held a maximum of 2,300,749,013 of its own shares during the year which represented 8.0 % of issued share capital at that time.