Vodafone 2016 Annual Report Download - page 129
Download and view the complete annual report
Please find page 129 of the 2016 Vodafone annual report below. You can navigate through the pages in the report by either clicking on the pages listed below, or by using the keyword search tool below to find specific information within the annual report.-
 1
1 -
2
-
3
-
4
-
5
-
6
-
7
-
8
-
9
-
10
-
11
-
12
-
13
-
14
-
15
-
16
-
17
-
18
-
19
-
20
-
21
-
22
-
23
-
24
-
25
-
26
-
27
-
28
-
29
-
30
-
31
-
32
-
33
-
34
-
35
-
36
-
37
-
38
-
39
-
40
-
41
-
42
-
43
-
44
-
45
-
46
-
47
-
48
-
49
-
50
-
51
-
52
-
53
-
54
-
55
-
56
-
57
-
58
-
59
-
60
-
61
-
62
-
63
-
64
-
65
-
66
-
67
-
68
-
69
-
70
-
71
-
72
-
73
-
74
-
75
-
76
-
77
-
78
-
79
-
80
-
81
-
82
-
83
-
84
-
85
-
86
-
87
-
88
-
89
-
90
-
91
-
92
-
93
-
94
-
95
-
96
-
97
-
98
-
99
-
100
-
101
-
102
-
103
-
104
-
105
-
106
-
107
-
108
-
109
-
110
-
111
-
112
-
113
-
114
-
115
-
116
-
117
-
118
-
 119
119 -
 120
120 -
 121
121 -
 122
122 -
 123
123 -
 124
124 -
 125
125 -
 126
126 -
 127
127 -
 128
128 -
 129
129 -
 130
130 -
 131
131 -
 132
132 -
 133
133 -
 134
134 -
 135
135 -
 136
136 -
 137
137 -
 138
138 -
 139
139 -
140
-
141
-
142
-
143
-
144
-
145
-
146
-
147
-
148
-
149
-
150
-
151
-
152
-
153
-
154
-
155
-
156
-
157
-
158
-
159
-
160
-
161
-
162
-
163
-
164
-
165
-
166
-
167
-
168
-
169
-
170
-
171
-
172
-
173
-
174
-
175
-
176
-
177
-
178
-
179
-
180
-
181
-
182
-
183
-
184
-
185
-
186
-
187
-
188
-
189
-
190
-
191
-
192
-
193
-
194
-
195
-
196
-
197
-
198
-
199
-
200
-
201
-
202
-
203
-
204
-
205
-
206
-
207
-
208
 |
 |

Overview Strategy review Performance Governance Financials Additional information
Vodafone Group Plc
Annual Report 2016
127
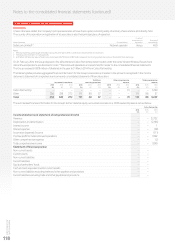
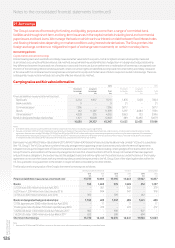
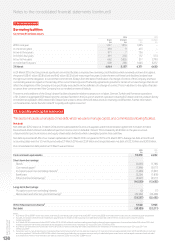
The fair value and carrying value of the Group’s long-term borrowings are as follows:
Sterling equivalent nominal value Fair value Carrying value
2016 2015 2016 2015 2016 2015
£m £m £m £m £m £m
Financial liabilities measured at amortised cost: 5,533 5,306 7, 2 6 0 5,346 7,19 2 5,261
Bank loans 5,298 5,173 7,025 5,213 6,957 5 ,12 8
Other liabilities1235 133 235 133 235 133
Bonds: 10,707 6,002 11,475 6,908 11,287 6,684
4.75% euro 500 million bond due June 2016 – 268 – 283 – 287
5.375% sterling 600 million bond due December 2017 549 549 583 605 566 568
5% euro 750 million bond due June 2018 593 542 656 622 617 564
8.125% sterling 450 million bond due November 2018 450 450 524 553 473 476
Floating rate note euro 1,750 million bond due February 2019 1,384 – 1,397 – 1,386 –
1% euro 1,750 million bond due September 2020 1,384 1,265 1,402 1,283 1,383 1,263
0% convertible sterling 600 million bond due November 2020 600 – 600 – 553 –
0.875% euro 750 million bond due November 2020 593 – 597 – 591 –
Floating rate note US dollar 60 million bond due March 2021 42 – 42 – 41 –
1.25% euro 1,250 million bond due August 2021 988 – 1,012 – 985 –
4.65% euro 1,250 million bond due January 2022 988 904 1,192 1,129 1,157 1,081
5.375% euro 500 million bond due June 2022 395 361 497 475 513 484
1.75% euro 1,250 million bond due August 2023 988 – 1,026 – 986 –
1.875% euro 1,000 million bond due September 2025 791 723 817 768 790 721
5.625% sterling 250 million bond due December 2025 250 250 299 313 335 343
5.9% sterling 450 million bond due November 2032 450 450 545 592 647 656
2.75% euro 332 million bond due December 2034 262 240 286 285 264 241
Bonds in designated hedge relationships: 9,680 9,397 10,218 10,201 10,848 10,490
5.625% US dollar 1,300 million bond due February 2017 – 876 – 946 – 920
1.625% US dollar 1,000 million bond due March 2017 – 674 – 679 – 672
1.25% US dollar 1,000 million bond due September 2017 695 674 693 670 694 672
1.5% US dollar 1,400 million bond due February 2018 973 943 973 942 972 941
4.625% US dollar 500 million bond due July 2018 347 337 369 367 376 375
5.45% US dollar 1,250 million bond due June 2019 868 842 957 955 957 938
4.375% US dollar 500 million bond due March 2021 347 337 379 371 363 346
2.5% US dollar 1,000 million bond due September 2022 695 674 694 654 713 667
2.95% US dollar 1,600 million bond due February 2023 1,112 1,078 1,10 0 1,066 1,199 1,121
3.125% norwegian krona 850 million bond due November 2025 71 – 78 – 72 –
2.2% euro 1,750 million bond due August 2026 1,384 – 1,451 – 1,379 –
6.6324% euro 50 million bond due December 2028 40 36 115 109 102 86
7.875% US dollar 750 million bond due February 2030 521 505 665 711 781 771
6.25% US dollar 495 million bond due November 2032 344 333 399 410 454 445
6.15% US dollar 1,700 million bond due February 2037 1,181 1,145 1,327 1,392 1,615 1,578
4.375% US dollar 1,400 million bond due February 2043 973 943 886 929 1,040 958
5.35% US dollar 186 million bond due December 2045 129 – 132 – 131 –
Long-term borrowings 25,920 20,705 28,953 22,455 29,327 22,435
Note:
1 Amounts for 2016 include £69 million in relation to the long-term debt component of the mandatory convertible bonds.
Fair values of bonds and nancial liabilities measured at amortised cost are based on level 1 and 2 of the fair value hierarchy respectively, using
quoted market prices or discounted cash ows with a discount rate based upon forward interest rates available to the Group at the reporting date.
Further information can be found in note 23 “Capital and nancial risk management”.