Vodafone 2016 Annual Report Download - page 145
Download and view the complete annual report
Please find page 145 of the 2016 Vodafone annual report below. You can navigate through the pages in the report by either clicking on the pages listed below, or by using the keyword search tool below to find specific information within the annual report.-
 1
1 -
2
-
3
-
4
-
5
-
6
-
7
-
8
-
9
-
10
-
11
-
12
-
13
-
14
-
15
-
16
-
17
-
18
-
19
-
20
-
21
-
22
-
23
-
24
-
25
-
26
-
27
-
28
-
29
-
30
-
31
-
32
-
33
-
34
-
35
-
36
-
37
-
38
-
39
-
40
-
41
-
42
-
43
-
44
-
45
-
46
-
47
-
48
-
49
-
50
-
51
-
52
-
53
-
54
-
55
-
56
-
57
-
58
-
59
-
60
-
61
-
62
-
63
-
64
-
65
-
66
-
67
-
68
-
69
-
70
-
71
-
72
-
73
-
74
-
75
-
76
-
77
-
78
-
79
-
80
-
81
-
82
-
83
-
84
-
85
-
86
-
87
-
88
-
89
-
90
-
91
-
92
-
93
-
94
-
95
-
96
-
97
-
98
-
99
-
100
-
101
-
102
-
103
-
104
-
105
-
106
-
107
-
108
-
109
-
110
-
111
-
112
-
113
-
114
-
115
-
116
-
117
-
118
-
119
-
120
-
121
-
122
-
123
-
124
-
125
-
126
-
127
-
128
-
129
-
130
-
131
-
132
-
133
-
134
-
 135
135 -
 136
136 -
 137
137 -
 138
138 -
 139
139 -
 140
140 -
 141
141 -
 142
142 -
 143
143 -
 144
144 -
 145
145 -
 146
146 -
 147
147 -
 148
148 -
 149
149 -
 150
150 -
 151
151 -
 152
152 -
 153
153 -
 154
154 -
 155
155 -
156
-
157
-
158
-
159
-
160
-
161
-
162
-
163
-
164
-
165
-
166
-
167
-
168
-
169
-
170
-
171
-
172
-
173
-
174
-
175
-
176
-
177
-
178
-
179
-
180
-
181
-
182
-
183
-
184
-
185
-
186
-
187
-
188
-
189
-
190
-
191
-
192
-
193
-
194
-
195
-
196
-
197
-
198
-
199
-
200
-
201
-
202
-
203
-
204
-
205
-
206
-
207
-
208
 |
 |

Overview Strategy review Performance Governance Financials Additional information
Vodafone Group Plc
Annual Report 2016
143
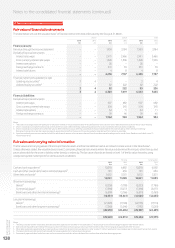
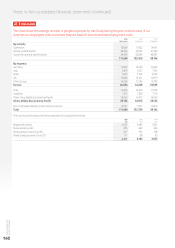
Charges made to the consolidated income statement and consolidated statement of comprehensive income (‘SOCI’) on the basis of the
assumptions stated above are:
2016 2015 2014
£m £m £m
Current service cost 36 37 14
Net interest charge 8320
Total included within staff costs 44 40 34
Actuarial (gains)/losses recognised in the SOCI1(156) 269 (57)
Note:
1 Amounts disclosed in the SOCI are stated net of £30 million of tax (2015: £57 million; 2014: £20 million).
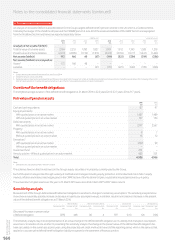
Fair value of the assets and present value of the liabilities of the schemes
The amount included in the statement of nancial position arising from the Group’s obligations in respect of its dened benet schemes is as follows:
Assets Liabilities Net decit
£m £m £m
1 April 2014 3,842 (4,391) (549)
Service cost – (37) (37)
Interest income/(cost) 176 (179) (3)
Return on plan assets excluding interest income 721 – 721
Actuarial losses arising from changes in nancial assumptions – (982) (982)
Actuarial losses arising from experience adjustments – (8) (8)
Employer cash contributions 404 – 404
Member cash contributions 9(9) –
Benets paid (95) 95 –
Exchange rate movements (83) 116 33
Other movements (18) 41 23
31 March 2015 4,956 (5,354) (398)
Service cost –(36) (36)
Interest income/(cost) 149 (157) (8)
Return on plan assets excluding interest income (151) – (151)
Actuarial gains arising from changes in demographic assumptions – 71 71
Actuarial gains arising from changes in nancial assumptions – 276 276
Actuarial losses arising from experience adjustments – (40) (40)
Employer cash contributions 27 – 27
Member cash contributions 7(7) –
Benets paid (118) 118 –
Exchange rate movements 59 (84) (25)
Other movements (4) 18 14
31 March 2016 4,925 (5,195) (270)
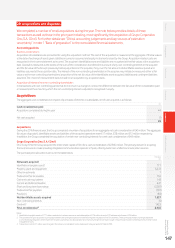
An analysis of net (decit)/assets is provided below for the Group as a whole.
2016 2015 2014 2013 2012
£m £m £m £m £m
Analysis of net decit:
Total fair value of scheme assets 4,925 4,956 3,842 3,723 1,604
Present value of funded schemeliabilities (5,129) (5,288) (4,325) (4,239) (1,853)
Net decit for funded schemes (204) (332) (483) (516) (249)
Present value of unfunded scheme liabilities (66) (66) (66) (12) (12)
Net decit (270) (398) (549) (528) (261)
Net decit is analysed as:
Assets1177 169 35 52 31
Liabilities (447) (567) (584) (580) (292)
Note:
1 Pension assets are deemed to be recoverable and there are no adjustments in respect of minimum funding requirements as future economic benets are available to the Company either in the
form of future refunds or, for plans still open to benet accrual, in the form of possible reductions in future contributions.