Vodafone 2016 Annual Report Download - page 166
Download and view the complete annual report
Please find page 166 of the 2016 Vodafone annual report below. You can navigate through the pages in the report by either clicking on the pages listed below, or by using the keyword search tool below to find specific information within the annual report.-
 1
1 -
2
-
3
-
4
-
5
-
6
-
7
-
8
-
9
-
10
-
11
-
12
-
13
-
14
-
15
-
16
-
17
-
18
-
19
-
20
-
21
-
22
-
23
-
24
-
25
-
26
-
27
-
28
-
29
-
30
-
31
-
32
-
33
-
34
-
35
-
36
-
37
-
38
-
39
-
40
-
41
-
42
-
43
-
44
-
45
-
46
-
47
-
48
-
49
-
50
-
51
-
52
-
53
-
54
-
55
-
56
-
57
-
58
-
59
-
60
-
61
-
62
-
63
-
64
-
65
-
66
-
67
-
68
-
69
-
70
-
71
-
72
-
73
-
74
-
75
-
76
-
77
-
78
-
79
-
80
-
81
-
82
-
83
-
84
-
85
-
86
-
87
-
88
-
89
-
90
-
91
-
92
-
93
-
94
-
95
-
96
-
97
-
98
-
99
-
100
-
101
-
102
-
103
-
104
-
105
-
106
-
107
-
108
-
109
-
110
-
111
-
112
-
113
-
114
-
115
-
116
-
117
-
118
-
119
-
120
-
121
-
122
-
123
-
124
-
125
-
126
-
127
-
128
-
129
-
130
-
131
-
132
-
133
-
134
-
135
-
136
-
137
-
138
-
139
-
140
-
141
-
142
-
143
-
144
-
145
-
146
-
147
-
148
-
149
-
150
-
151
-
152
-
153
-
154
-
155
-
 156
156 -
 157
157 -
 158
158 -
 159
159 -
 160
160 -
 161
161 -
 162
162 -
 163
163 -
 164
164 -
 165
165 -
 166
166 -
 167
167 -
 168
168 -
 169
169 -
 170
170 -
 171
171 -
 172
172 -
 173
173 -
 174
174 -
 175
175 -
 176
176 -
177
-
178
-
179
-
180
-
181
-
182
-
183
-
184
-
185
-
186
-
187
-
188
-
189
-
190
-
191
-
192
-
193
-
194
-
195
-
196
-
197
-
198
-
199
-
200
-
201
-
202
-
203
-
204
-
205
-
206
-
207
-
208
 |
 |

Vodafone Group Plc
Annual Report 2016
164
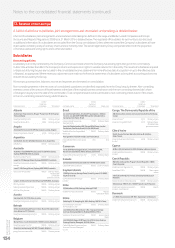
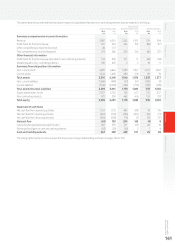
Other unaudited nancial information (continued)
Prior year operating results (continued)
Europe1
% change
Germany
£m
Italy
£m
UK
£m
Spain
£m
Other Europe
£m
Eliminations
£m
Europe
£m £Organic*
Year ended 31 March 2015 restated
Revenue 8,384 4,587 6 ,19 9 3 , 614 4,993 (90) 2 7, 6 8 7 15.7 (4.5)
Service revenue 7, 74 6 4,062 5,893 3,320 4,652 (85) 25,588 14.7 (5.0)
Other revenue 638 525 306 294 341 (5) 2,099
EBITDA 2,659 1,535 1,345 782 1,573 –7,8 9 4 16 .3 (12.3)
Adjusted operating prot 530 644 26 2 531 –1,733 (24.7) (40.6)
EBITDA margin 31.7% 33.5% 21.7% 21.6% 31.5% 28.5%
Year ended 31 March 2014 restated
Revenue 8,220 518 6,249 3,470 5 ,515 (43) 23,929 0.2 (8.8)
Service revenue 7, 6 87 4 61 5,918 3,18 3 5,090 (40) 22,299 0.6 (8.2)
Other revenue 533 57 331 287 425 (3) 1,630
EBITDA 2,688 181 1,399 785 1,735 –6,788 (5.5) (17.1)
Adjusted operating prot 907 372 167 179 676 – 2,301 (38.5) (41.9)
EBITDA margin 32.7% 34.9% 22.4% 22.6% 31.5% 28.4%
Note:
1 The Group has amended its reporting to reect changes in the internal management of its Enterprise business. The primary change has been that on 1 April 2015, the Group redened its
segments to report international voice transit revenue and costs within Common Functions rather than within the results disclosed for each country and region. The results presented for the
year ended 31 March 2015 and 2014 have been restated onto a comparable basis. There is no impact on total Group revenue or cost.
Revenue increased 15.7%. M&A activity, including KDG, Ono and the
consolidation of Vodafone Italy, contributed a 26.7 percentage point
positive impact, while foreign exchange movements contributed a 6.5
percentage point negative impact. On an organic basis, service revenue
declined 5.0%*, driven primarily by price competition and the impact
of MTR cuts.
EBITDA increased 16.3%, including a 35.6 percentage point positive
impact from M&A activity and a 7.0 percentage point negative impact
from foreign exchange movements. On an organic basis EBITDA
declined 12.3%*, reecting the weak organic revenue trend.
Organic
change*
%
Other
activity1
pps
Foreign
exchange
pps
Reported
change
%
Revenue – Europe (4.5) 26.7 (6.5) 15.7
Service revenue
Germany (3.7) 12.0 (7.5) 0.8
Italy1(10.2) 916.7 (125.4) 781.1
UK (1.8) 1.4 –(0.4)
Spain (10.9) 22.9 (7.7) 4.3
Other Europe (2.2) 0.8 (7.2) (8.6)
Europe (5.0) 26.2 (6.5) 14.7
EBITDA
Germany (11 . 0) 17.3 ( 7. 4 ) (1.1)
Italy1(15.3) 882.7 (119.3) 74 8.1
UK (12.4) 8.5 –(3.9)
Spain (29.5) 36.3 (7.2) (0.4)
Other Europe (2.8) 0.5 (7.0) (9.3)
Europe (12.3) 35.6 (7.0) 16.3
Adjusted operating prot
Europe (40.6) 20.6 (4.7) (24.7)
Note:
1 “Other activity” includes the impact of M&A activity. Refer to “Organic growth” on page 191
for further detail.
Germany
Service revenue decreased 3.7%* excluding KDG. Q4 service revenue
was down 3.5%*.
Mobile service revenue fell 3.5%*, mainly as a result of price reductions
in the prior year continuing to penetrate the consumer customer
base. The contract customer base grew, supported by a stronger
commercial performance as we look to increase our focus on direct,
branded channels, falling churn and the ongoing substantial investment
in network infrastructure. We increased our 4G coverage to 77% of the
population and signicantly improved voice coverage and reliability,
as evidenced in independent tests. At the end of the period we had
5.0 million 4G customers.
Fixed service revenue excluding KDG fell 4.4%*, reecting ongoing
declines in our Vodafone DSL customer base, in part from migrations
to KDG cable infrastructure. The rate of decline eased during the year
(H1 -5.0%*; H2 -3.8%*), with an improving rate of gross customer
additions and increasing demand for high speed broadband (‘VDSL’),
as well as stronger growth in carrier services. KDG maintained its
strong rate of growth, contributing £1,492 million to service revenue
and £676 million to EBITDA, and adding 0.4 million broadband
customers (excluding migrations from Vodafone DSL) during the
year. The integration of KDG has continued, including the launch
of a combined xed/mobile proposition in H2.
EBITDA declined 11.0%*, with a 3.0* percentage point decline in EBITDA
margin, driven by lower service revenue and a higher level of customer
investment year-on-year, partially compensated by a year-on-year
reduction in operating expenses.