Vodafone 2016 Annual Report Download - page 105
Download and view the complete annual report
Please find page 105 of the 2016 Vodafone annual report below. You can navigate through the pages in the report by either clicking on the pages listed below, or by using the keyword search tool below to find specific information within the annual report.-
 1
1 -
2
-
3
-
4
-
5
-
6
-
7
-
8
-
9
-
10
-
11
-
12
-
13
-
14
-
15
-
16
-
17
-
18
-
19
-
20
-
21
-
22
-
23
-
24
-
25
-
26
-
27
-
28
-
29
-
30
-
31
-
32
-
33
-
34
-
35
-
36
-
37
-
38
-
39
-
40
-
41
-
42
-
43
-
44
-
45
-
46
-
47
-
48
-
49
-
50
-
51
-
52
-
53
-
54
-
55
-
56
-
57
-
58
-
59
-
60
-
61
-
62
-
63
-
64
-
65
-
66
-
67
-
68
-
69
-
70
-
71
-
72
-
73
-
74
-
75
-
76
-
77
-
78
-
79
-
80
-
81
-
82
-
83
-
84
-
85
-
86
-
87
-
88
-
89
-
90
-
91
-
92
-
93
-
94
-
 95
95 -
 96
96 -
 97
97 -
 98
98 -
 99
99 -
 100
100 -
 101
101 -
 102
102 -
 103
103 -
 104
104 -
 105
105 -
 106
106 -
 107
107 -
 108
108 -
 109
109 -
 110
110 -
 111
111 -
 112
112 -
 113
113 -
 114
114 -
 115
115 -
116
-
117
-
118
-
119
-
120
-
121
-
122
-
123
-
124
-
125
-
126
-
127
-
128
-
129
-
130
-
131
-
132
-
133
-
134
-
135
-
136
-
137
-
138
-
139
-
140
-
141
-
142
-
143
-
144
-
145
-
146
-
147
-
148
-
149
-
150
-
151
-
152
-
153
-
154
-
155
-
156
-
157
-
158
-
159
-
160
-
161
-
162
-
163
-
164
-
165
-
166
-
167
-
168
-
169
-
170
-
171
-
172
-
173
-
174
-
175
-
176
-
177
-
178
-
179
-
180
-
181
-
182
-
183
-
184
-
185
-
186
-
187
-
188
-
189
-
190
-
191
-
192
-
193
-
194
-
195
-
196
-
197
-
198
-
199
-
200
-
201
-
202
-
203
-
204
-
205
-
206
-
207
-
208
 |
 |

Overview Strategy review Performance Governance Financials Additional information
Vodafone Group Plc
Annual Report 2016
103
Year ended 31 March 2014
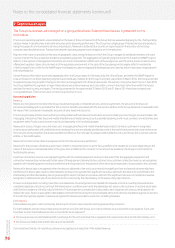
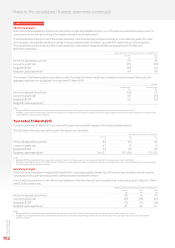
During the year ended 31 March 2014 impairment charges of £4,900 million, £800 million, £500 million, £200 million and £200 million were
recorded in respect of the Group’s investments in Germany, Spain, Portugal, Czech Republic and Romania respectively. The impairment charges
related solely to goodwill. The recoverable amounts of Germany, Spain, Portugal, Czech Republic and Romania were £23.0 billion, £3.3 billion,
£1.3 billion, £0.6 billion and £1.2 billion respectively.
The impairment charges were driven by lower projected cash ows within the business plans resulting in our reassessment of expected future
business performance in the light of current trading and economic conditions.
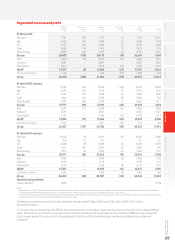
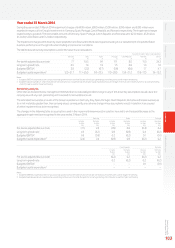
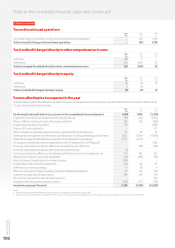
The table below shows key assumptions used in the value in use calculations.
Assumptions used in value in use calculation
Germany Italy Spain Portugal Czech Republic Romania Greece
% % % % % % %
Pre-tax risk adjusted discount rate 7.7 10.5 9.9 11.1 8.0 11.0 24.3
Long-term growth rate 0.5 1.0 1.9 1.5 0.8 1.0 1.0
Budgeted EBITDA12.8 (2.2) (0.7) (0.8) (0.6) 1.7 4.7
Budgeted capital expenditure212.5–21.7 11.1–25.5 9.0–23.5 11.0 –28.3 15.9–21.2 10.5 –17.3 7.6 –12.2
Notes:
1 Budgeted EBITDA is expressed as the compound annual growth rates in the initial ve years for all cash-generating units of the plans used for impairment testing.
2 Budgeted capital expenditure, which excludes licences and spectrum, is expressed as the range of capital expenditure as a percentage of revenue in the initial ve years for all cash-generating
units of the plans used for impairment testing.
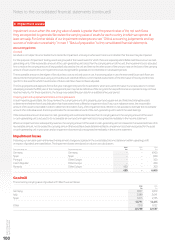
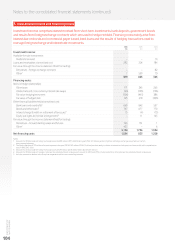
Sensitivity analysis
Other than as disclosed below, management believed that no reasonably possible change in any of the above key assumptions would cause the
carrying value of any cash-generating unit to exceed its recoverable amount.
The estimated recoverable amounts of the Group’s operations in Germany, Italy, Spain, Portugal, Czech Republic, Romania and Greece were equal
to, or not materially greater than, their carrying values; consequently, any adverse change in key assumptions would, in isolation, have caused
a further impairment loss to be recognised.
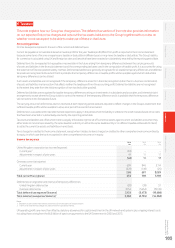
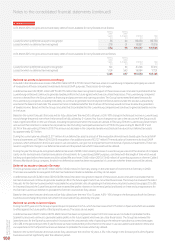
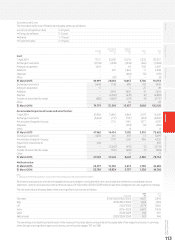
The changes in the following table to assumptions used in the impairment review would, in isolation, have led to an (increase)/decrease to the
aggregate impairment loss recognised in the year ended 31 March 2014.
Germany Spain Portugal
Increase Decrease Increase Decrease Increase Decrease
by 2pps by 2pps by 2pps by 2pps by 2pps by 2pps
£bn £bn £bn £bn £bn £bn
Pre-tax risk adjusted discount rate (7.1) 4.9 (0.9) 0.8 (0.3) 0.4
Long-term growth rate 4.9 (5.2) 0.8 (0.8) 0.4 (0.2)
Budgeted EBITDA10.8 (0.8) 0.2 (0.2) 0.1 (0.1)
Budgeted capital expenditure2(2.4) 2.4 (0.8) 0.8 (0.2) 0.2
Czech Republic Romania
Increase Decrease Increase Decrease
by 2pps by 2pps by 2pps by 2pps
£bn £bn £bn £bn
Pre-tax risk adjusted discount rate (0.2) 0.2 (0.2) 0.2
Long-term growth rate 0.2 (0.2) 0.2 (0.2)
Budgeted EBITDA1– – 0.1 (0.1)
Budgeted capital expenditure2– – – –
Notes:
1 Budgeted EBITDA is expressed as the compound annual growth rates in the initial ve years for all cash-generating units of the plans used for impairment testing.
2 Budgeted capital expenditure is expressed as a percentage of revenue in the initial ve years for all cash-generating units of the plans used for impairment testing.