Vodafone 2016 Annual Report Download - page 174
Download and view the complete annual report
Please find page 174 of the 2016 Vodafone annual report below. You can navigate through the pages in the report by either clicking on the pages listed below, or by using the keyword search tool below to find specific information within the annual report.-
 1
1 -
2
-
3
-
4
-
5
-
6
-
7
-
8
-
9
-
10
-
11
-
12
-
13
-
14
-
15
-
16
-
17
-
18
-
19
-
20
-
21
-
22
-
23
-
24
-
25
-
26
-
27
-
28
-
29
-
30
-
31
-
32
-
33
-
34
-
35
-
36
-
37
-
38
-
39
-
40
-
41
-
42
-
43
-
44
-
45
-
46
-
47
-
48
-
49
-
50
-
51
-
52
-
53
-
54
-
55
-
56
-
57
-
58
-
59
-
60
-
61
-
62
-
63
-
64
-
65
-
66
-
67
-
68
-
69
-
70
-
71
-
72
-
73
-
74
-
75
-
76
-
77
-
78
-
79
-
80
-
81
-
82
-
83
-
84
-
85
-
86
-
87
-
88
-
89
-
90
-
91
-
92
-
93
-
94
-
95
-
96
-
97
-
98
-
99
-
100
-
101
-
102
-
103
-
104
-
105
-
106
-
107
-
108
-
109
-
110
-
111
-
112
-
113
-
114
-
115
-
116
-
117
-
118
-
119
-
120
-
121
-
122
-
123
-
124
-
125
-
126
-
127
-
128
-
129
-
130
-
131
-
132
-
133
-
134
-
135
-
136
-
137
-
138
-
139
-
140
-
141
-
142
-
143
-
144
-
145
-
146
-
147
-
148
-
149
-
150
-
151
-
152
-
153
-
154
-
155
-
156
-
157
-
158
-
159
-
160
-
161
-
162
-
163
-
 164
164 -
 165
165 -
 166
166 -
 167
167 -
 168
168 -
 169
169 -
 170
170 -
 171
171 -
 172
172 -
 173
173 -
 174
174 -
 175
175 -
 176
176 -
 177
177 -
 178
178 -
 179
179 -
 180
180 -
 181
181 -
 182
182 -
 183
183 -
 184
184 -
185
-
186
-
187
-
188
-
189
-
190
-
191
-
192
-
193
-
194
-
195
-
196
-
197
-
198
-
199
-
200
-
201
-
202
-
203
-
204
-
205
-
206
-
207
-
208
 |
 |

Vodafone Group Plc
Annual Report 2016
172
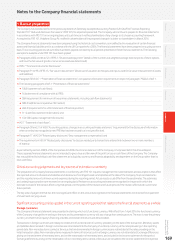
Notes to the Company nancial statements (continued)
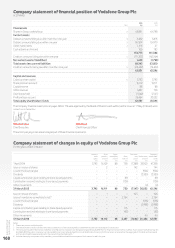
5. Creditors
Accounting policies
Capital market and bank borrowings
Interest bearing loans and overdrafts are initially measured at fair value (which is equal to cost at inception) and are subsequently measured
at amortised cost using the effective interest rate method, except where they are identied as a hedged item in a designated hedge relationship.
Any difference between the proceeds net of transaction costs and the amount due on settlement or redemption of borrowings is recognised over
the term of theborrowing.
2016 2015
£m £m
Amounts falling due within one year:
Bank loans and other loans 13,263 9,895
Amounts owed to subsidiaries 157,538 152,904
Derivative nancial instruments1387 327
Other creditors 78 13
Accruals and deferred income 37 25
171,303 163,164
Amounts falling due after more than one year:
Deferred tax – 4
Other loans 24,304 18,736
Derivative nancial instruments11,128 664
25,432 19,404
Note:
1 Amounts falling due within one year include amounts in relation to cross currency swaps £235 million (2015: £237 million) of which £229 million relates to transactions with joint ventures
(2015: £237 million), interest rate swaps £29 million (2015: £44 million), options £64 million (2015: £nil) and foreign exchange contracts £59 million (2015: £46 million). The amounts
falling due in more than one year include amounts in relation to cross currency swaps £528 million (2015: £8 million), interest rate swaps £600 million (2015: £645 million) and options £nil
(2015: £11 million).
Included in amounts falling due after more than one year are other loans of £13,611 million which are due in more than ve years from 1 April 2016
and are payable otherwise than by instalments. Interest payable on these loans ranges from 0.491% to 7.875%.
On November 2015, the Group issued £600 million zero-coupon equity linked bonds maturing on 26 November 2020.
Amounts included in bank loans and other loans due within one year and in other loans due after more than one year of £50 million and £69 million
respectively represent the carrying value of future coupons on the mandatory convertible bonds issued on 25 February 2016. The mandatory
convertible bonds are compound instruments with nominal values recognised as a component of shareholders’ equity (refer to the statement
of changes in equity on page 168) with the initial fair value of future coupons recognised as nancial liabilities in borrowings and subsequently
measured at amortised cost using the effective interest rate method.
Details of bond and other debt issuances are set out in note 22 “Liquidity and capital resources” on pages 131 to 133 in the consolidated
nancial statements.
6. Share capital
Accounting policies
Equity instruments issued by the Company are recorded as the proceeds received, net of direct issuance costs.
2016 2015
Number £m Number £m
Ordinary shares of 2020⁄21 US cents each allotted,
issued and fully paid:1,2
1 April 28,812,787,098 3,792 28,811,923,128 3,792
Allotted during the year 608,910 –863,970 –
31 March 28,813,396,008 3,792 28,812,787,098 3,792
Notes:
1 50,000 (2015: 50,000) 7% cumulative xed rate shares of £1 each were allotted, issued and fully paid by the Company.
2 At 31 March 2016, the Company held 2,254,825,696 (2015: 2,300,749,013) treasury shares with a nominal value of £328 million (2015: £303 million).
During 2014, the Company issued 14,732,741,283 B shares of US$1.88477 per share and 33,737,176,433 C shares of US$0.00001 per share as part
of the Return of Value following the disposal of our US Group, whose principal asset was its 45% stake in Verizon Wireless (‘VZW’). The B shares were
cancelled as part of the Return of Value. The C shares were reclassied as deferred shares with no substantive rights as part of the Return of Value
and transferred to LDC (Shares) Limited (‘LDC’). On 8 May 2015, the Company repurchased and then subsequently cancelled all deferred shares.
On 19 February 2016, the Company issued £2.9 billion of subordinated mandatory convertible bonds issued in two tranches, with the rst
£1.4 billion maturing on 25 August 2017 and a further £1.4 billion maturing on 25 February 2019. At the initial conversion price of £2.1730,
at maturity the bonds will convert to 1, 325,356,650 Vodafone Group Plc shares representing approximately 5% of Vodafone’s share capital.
Further details are included in note 22 “Liquidity and capital resources” to the consolidated nancial statements.