Vodafone 2016 Annual Report Download - page 33
Download and view the complete annual report
Please find page 33 of the 2016 Vodafone annual report below. You can navigate through the pages in the report by either clicking on the pages listed below, or by using the keyword search tool below to find specific information within the annual report.-
 1
1 -
2
-
3
-
4
-
5
-
6
-
7
-
8
-
9
-
10
-
11
-
12
-
13
-
14
-
15
-
16
-
17
-
18
-
19
-
20
-
21
-
22
-
 23
23 -
 24
24 -
 25
25 -
 26
26 -
 27
27 -
 28
28 -
 29
29 -
 30
30 -
 31
31 -
 32
32 -
 33
33 -
 34
34 -
 35
35 -
 36
36 -
 37
37 -
 38
38 -
 39
39 -
 40
40 -
 41
41 -
 42
42 -
 43
43 -
44
-
45
-
46
-
47
-
48
-
49
-
50
-
51
-
52
-
53
-
54
-
55
-
56
-
57
-
58
-
59
-
60
-
61
-
62
-
63
-
64
-
65
-
66
-
67
-
68
-
69
-
70
-
71
-
72
-
73
-
74
-
75
-
76
-
77
-
78
-
79
-
80
-
81
-
82
-
83
-
84
-
85
-
86
-
87
-
88
-
89
-
90
-
91
-
92
-
93
-
94
-
95
-
96
-
97
-
98
-
99
-
100
-
101
-
102
-
103
-
104
-
105
-
106
-
107
-
108
-
109
-
110
-
111
-
112
-
113
-
114
-
115
-
116
-
117
-
118
-
119
-
120
-
121
-
122
-
123
-
124
-
125
-
126
-
127
-
128
-
129
-
130
-
131
-
132
-
133
-
134
-
135
-
136
-
137
-
138
-
139
-
140
-
141
-
142
-
143
-
144
-
145
-
146
-
147
-
148
-
149
-
150
-
151
-
152
-
153
-
154
-
155
-
156
-
157
-
158
-
159
-
160
-
161
-
162
-
163
-
164
-
165
-
166
-
167
-
168
-
169
-
170
-
171
-
172
-
173
-
174
-
175
-
176
-
177
-
178
-
179
-
180
-
181
-
182
-
183
-
184
-
185
-
186
-
187
-
188
-
189
-
190
-
191
-
192
-
193
-
194
-
195
-
196
-
197
-
198
-
199
-
200
-
201
-
202
-
203
-
204
-
205
-
206
-
207
-
208
 |
 |

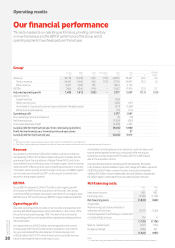
Net nancing costs, excluding mark-to-market losses and foreign
exchange differences in relation to certain intercompany balances,
decreased by 3% primarily due to the impact of foreign exchange losses
on nancing costs.
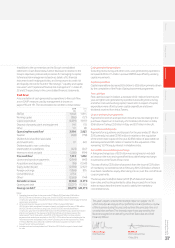
Taxation
2016
£m
2015
£m
Income tax
Continuing operations before deferred tax on
revaluation of investments in Luxembourg (162) (703)
Deferred tax on revaluation of investments
inLuxembourg (3,207) 5,468
Total income tax (expense)/credit –
continuing operations (3,369) 4,765
Tax on adjustments to derive adjusted
prot before tax (436) (305)
Recognition of deferred tax asset for losses
inLuxembourg – (3,341)
Deferred tax following revaluation
ofinvestments in Luxembourg 3,207 (2,127)
Deferred tax on use of Luxembourg losses 423 439
Adjusted income tax expense (175) (569)
Share of associates’ and joint ventures’ tax (104) (117)
Adjusted income tax expense for
calculating adjusted tax rate (279) (686)
(Loss)/prot before tax (449) 1,095
Adjustments to derive adjusted
prot beforetax (see earnings per share) 2 ,191 1,12 2
Adjusted prot before tax 1,74 2 2,217
Share of associates’ and joint ventures’ tax
andnon-controlling interest 104 117
Adjusted prot before tax for calculating
adjusted effective tax rate 1,846 2,334
Adjusted effective tax rate 15.1% 29.4%
The Group’s underlying tax rate for the year ended 31 March 2016
was 28.8%. Certain non-recurring items had a signicant effect on the
adjusted effective tax rate in the year, which was 15.1%. These include
a benet of 18.4% following the restructuring and simplication of our
Indian business, partially offset by a tax cost of 4.6% due to the reduction
in the UK corporation tax rate (which resulted in a decrease in the value
of our UK capital allowances).
The Group’s adjusted effective tax rate is expected to be in the
mid-twenties over the medium term reecting the ongoing impact
fromthe re-organisation of our Indian business.
The Group’s adjusted effective tax rate for both years does not
include the use of Luxembourg losses in the year of £423 million
(2015: £439 million) and a reduction in the deferred tax asset in the
period of £3,207 million (2015: recognition of an additional asset
of £2,127 million) arising from the tax treatment of the revaluation
of investments based upon the local GAAP nancial statements.
These items reduce the amount of losses we have available for future
use against our prots in Luxembourg and do not affect the amount
of tax we pay in other countries.
Additionally, the adjusted effective tax rate in the year ended 31 March
2015 did not include the impact of the recognition of an additional
£3,341 million deferred tax asset in respect of the Group’s historic tax
losses in Luxembourg. The losses were recognised as a consequence
of the acquisition of Ono.
Earnings per share
Adjusted earnings per share, which excludes the reduction in the tax
losses in Luxembourg following the revaluation of investments in the
local statutory accounts in the current period and the recognition
of deferred tax assets in respect of tax losses in Luxembourg in the prior
year, was 5.04 pence, a decrease of 9.2% year-on-year, reecting the
Group’s lower adjusted operating prot for the year.
Basic earnings per share was a loss of 15.08 pence primarily due to the
reduction in deferred tax on losses, as described above, which has been
excluded from adjusted earnings per share.
2016
£m
2015
£m
(Loss)/prot attributable to owners
ofthe parent (4,024) 5,761
Adjustments:
Impairment loss 450 –
Amortisation of acquired customer base
and brand intangible assets 979 1,269
Restructuring costs 236 157
Other income and expense 75 114
Non-operating income and expense 2 19
Investment income and nancing costs 449 (437)
2 ,191 1,122
Taxation 3 ,19 4 (5,334)
Discontinued operations – (57)
Non-controlling interests (17) (21)
Adjusted prot attributable to owners
ofthe parent 1,344 1,471
Overview Strategy review Performance Governance Financials Additional information
Vodafone Group Plc
Annual Report 2016
31