Vodafone 2016 Annual Report Download - page 148
Download and view the complete annual report
Please find page 148 of the 2016 Vodafone annual report below. You can navigate through the pages in the report by either clicking on the pages listed below, or by using the keyword search tool below to find specific information within the annual report.-
 1
1 -
2
-
3
-
4
-
5
-
6
-
7
-
8
-
9
-
10
-
11
-
12
-
13
-
14
-
15
-
16
-
17
-
18
-
19
-
20
-
21
-
22
-
23
-
24
-
25
-
26
-
27
-
28
-
29
-
30
-
31
-
32
-
33
-
34
-
35
-
36
-
37
-
38
-
39
-
40
-
41
-
42
-
43
-
44
-
45
-
46
-
47
-
48
-
49
-
50
-
51
-
52
-
53
-
54
-
55
-
56
-
57
-
58
-
59
-
60
-
61
-
62
-
63
-
64
-
65
-
66
-
67
-
68
-
69
-
70
-
71
-
72
-
73
-
74
-
75
-
76
-
77
-
78
-
79
-
80
-
81
-
82
-
83
-
84
-
85
-
86
-
87
-
88
-
89
-
90
-
91
-
92
-
93
-
94
-
95
-
96
-
97
-
98
-
99
-
100
-
101
-
102
-
103
-
104
-
105
-
106
-
107
-
108
-
109
-
110
-
111
-
112
-
113
-
114
-
115
-
116
-
117
-
118
-
119
-
120
-
121
-
122
-
123
-
124
-
125
-
126
-
127
-
128
-
129
-
130
-
131
-
132
-
133
-
134
-
135
-
136
-
137
-
 138
138 -
 139
139 -
 140
140 -
 141
141 -
 142
142 -
 143
143 -
 144
144 -
 145
145 -
 146
146 -
 147
147 -
 148
148 -
 149
149 -
 150
150 -
 151
151 -
 152
152 -
 153
153 -
 154
154 -
 155
155 -
 156
156 -
 157
157 -
 158
158 -
159
-
160
-
161
-
162
-
163
-
164
-
165
-
166
-
167
-
168
-
169
-
170
-
171
-
172
-
173
-
174
-
175
-
176
-
177
-
178
-
179
-
180
-
181
-
182
-
183
-
184
-
185
-
186
-
187
-
188
-
189
-
190
-
191
-
192
-
193
-
194
-
195
-
196
-
197
-
198
-
199
-
200
-
201
-
202
-
203
-
204
-
205
-
206
-
207
-
208
 |
 |

Vodafone Group Plc
Annual Report 2016
146
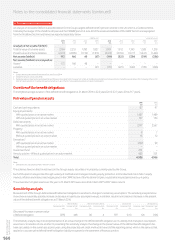
27. Share-based payments (continued)
Movements in outstanding ordinary share and ADS options
ADS options Ordinary share options
2016 2015 2014 2016 2015 2014
Millions Millions Millions Millions Millions Millions
1 April – 25 27 40
Granted during the year – – – 7 7 12
Forfeited during the year ––– (1) (2) (1)
Exercised during the year – – – (5) (6) (22)
Expired during the year – – – (2) (1) (2)
31 March ––– 24 25 27
Weighted average exercise price:
1 April – – US$22.16 £1.49 £1.42 £1.41
Granted during the year – – – £1.89 £1.56 £1.49
Forfeited during the year ––– £1.54 £1.45 £1.34
Exercised during the year – – US$29.31 £1.42 £1.25 £1.43
Expired during the year ––– £1.59 £1.45 £1.37
31 March – – – £1.62 £1.49 £1.42
Summary of options outstanding and exercisable at 31 March 2016
Outstanding Exercisable
Weighted Weighted
average average
Weighted remaining Weighted remaining
Outstanding average contractual Exercisable average contractual
shares exercise life shares exercise life
Millions price Months Millions price Months
Vodafone Group savings related and Sharesave Plan:
£1.01–£2.00 23 £1.62 29 –––
Vodafone Group 1999 Long-Term Stock Incentive Plan:
£1.01–£2.00 1£1.68 16 1£1.68 16
Share awards
Movements in non-vested shares are as follows:
2016 2015 2014
Weighted Weighted Weighted
average fair average fair average fair
value at value at value at
Millions grant date Millions grant date Millions grant date
1 April 217 £1.56 243 £1.44 294 £1.27
Granted 63 £2.22 83 £1.63 84 £1.58
Vested (32) £1.80 (62) £1.35 (81) £1.11
Forfeited (50) £1.40 (47) £1.35 (54) £1.19
31 March 198 £1.77 217 £1.56 243 £1.44
Other information
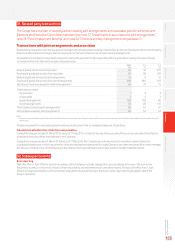
The total fair value of shares vested during the year ended 31 March 2016 was £58 million (2015: £84 million; 2014: £90 million).
The compensation cost included in the consolidated income statement in respect of share options and share plans was £117 million
(2015:£88 million; 2014: £92 million) which is comprised principally of equity-settled transactions.
The average share price for the year ended 31 March 2016 was 224.2 pence (2015: 212.7 pence; 2014: 212.2 pence).
Notes to the consolidated nancial statements (continued)