Vodafone 2011 Annual Report Download - page 99
Download and view the complete annual report
Please find page 99 of the 2011 Vodafone annual report below. You can navigate through the pages in the report by either clicking on the pages listed below, or by using the keyword search tool below to find specific information within the annual report.-
 1
1 -
2
-
3
-
4
-
5
-
6
-
7
-
8
-
9
-
10
-
11
-
12
-
13
-
14
-
15
-
16
-
17
-
18
-
19
-
20
-
21
-
22
-
23
-
24
-
25
-
26
-
27
-
28
-
29
-
30
-
31
-
32
-
33
-
34
-
35
-
36
-
37
-
38
-
39
-
40
-
41
-
42
-
43
-
44
-
45
-
46
-
47
-
48
-
49
-
50
-
51
-
52
-
53
-
54
-
55
-
56
-
57
-
58
-
59
-
60
-
61
-
62
-
63
-
64
-
65
-
66
-
67
-
68
-
69
-
70
-
71
-
72
-
73
-
74
-
75
-
76
-
77
-
78
-
79
-
80
-
81
-
82
-
83
-
84
-
85
-
86
-
87
-
88
-
 89
89 -
 90
90 -
 91
91 -
 92
92 -
 93
93 -
 94
94 -
 95
95 -
 96
96 -
 97
97 -
 98
98 -
 99
99 -
 100
100 -
 101
101 -
 102
102 -
 103
103 -
 104
104 -
 105
105 -
 106
106 -
 107
107 -
 108
108 -
 109
109 -
110
-
111
-
112
-
113
-
114
-
115
-
116
-
117
-
118
-
119
-
120
-
121
-
122
-
123
-
124
-
125
-
126
-
127
-
128
-
129
-
130
-
131
-
132
-
133
-
134
-
135
-
136
-
137
-
138
-
139
-
140
-
141
-
142
-
143
-
144
-
145
-
146
-
147
-
148
-
149
-
150
-
151
-
152
-
153
-
154
-
155
-
156
 |
 |

Vodafone Group Plc Annual Report 2011 97
Financials
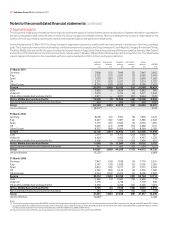
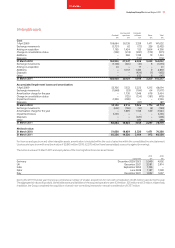
9. Intangible assets
Licences and Computer
Goodwill spectrum software Other Total
£m £m £m £m £m
Cost:
1 April 2009 106,664 26,138 7,359 1,471 141,632
Exchange movements (2,751) 62 (72) 326 (2,435)
Arising on acquisition 1,185 1,454 153 1,604 4,396
Change in consolidation status (102) (413) (281) (175) (971)
Additions – 306 1,199 19 1,524
Disposals – – (114) – (114)
31 March 2010 104,996 27,547 8,244 3,245 144,032
Exchange movements (1,120) (545) (16) 8 (1,673)
Arising on acquisition 24 – 17 – 41
Additions – 3,157 1,493 9 4,659
Disposals – – (424) (1) (425)
Other – – 635 8 643
31 March 2011 103,900 30,159 9,949 3,269 147,277
Accumulated impairment losses and amortisation:
1 April 2009 52,706 7,552 5,223 1,213 66,694
Exchange movements (1,848) (29) (104) 64 (1,917)
Amortisation charge for the year – 1,730 1,046 678 3,454
Change in consolidation status – (135) (154) (181) (470)
Impairment losses 2,300 (200) – – 2,100
Disposals – – (87) – (87)
31 March 2010 53,158 8,918 5,924 1,774 69,774
Exchange movements (644) (104) (14) (6) (768)
Amortisation charge for the year – 1,809 1,166 529 3,504
Impairment losses 6,150 – – – 6,150
Disposals – – (426) – (426)
Other – – 485 – 485
31 March 2011 58,664 10,623 7,135 2,297 78,719
Net book value:
31 March 2010 51,838 18,629 2,320 1,471 74,258
31 March 2011 45,236 19,536 2,814 972 68,558
For licences and spectrum and other intangible assets, amortisation is included within the cost of sales line within the consolidated income statement.
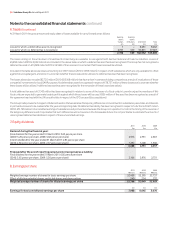
Licences and spectrum with a net book value of £3,845 million (2010: £2,570 million) have been pledged as security against borrowings.
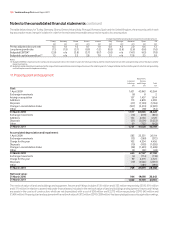
The net book value at 31 March 2011 and expiry dates of the most significant licences are as follows:
2011 2010
Expiry date £m £m
Germany December 2020/2025 5,540 4,802
UK December 2021 3,581 3,914
India September 2030 1,746 –
Qatar June 2028 1,187 1,328
Italy December 2021 1,002 1,097
During the 2011 financial year the Group completed a number of smaller acquisitions for net cash consideration of £46 million paid during the year.
The aggregate fair values of goodwill, identifiable assets and liabilities of the acquired operations were £24 million, £25 million and £3 million, respectively.
In addition, the Group completed the acquisition of certain non-controlling interests for net cash consideration of £137 million.