Vodafone 2011 Annual Report Download - page 50
Download and view the complete annual report
Please find page 50 of the 2011 Vodafone annual report below. You can navigate through the pages in the report by either clicking on the pages listed below, or by using the keyword search tool below to find specific information within the annual report.-
 1
1 -
2
-
3
-
4
-
5
-
6
-
7
-
8
-
9
-
10
-
11
-
12
-
13
-
14
-
15
-
16
-
17
-
18
-
19
-
20
-
21
-
22
-
23
-
24
-
25
-
26
-
27
-
28
-
29
-
30
-
31
-
32
-
33
-
34
-
35
-
36
-
37
-
38
-
39
-
 40
40 -
 41
41 -
 42
42 -
 43
43 -
 44
44 -
 45
45 -
 46
46 -
 47
47 -
 48
48 -
 49
49 -
 50
50 -
 51
51 -
 52
52 -
 53
53 -
 54
54 -
 55
55 -
 56
56 -
 57
57 -
 58
58 -
 59
59 -
 60
60 -
61
-
62
-
63
-
64
-
65
-
66
-
67
-
68
-
69
-
70
-
71
-
72
-
73
-
74
-
75
-
76
-
77
-
78
-
79
-
80
-
81
-
82
-
83
-
84
-
85
-
86
-
87
-
88
-
89
-
90
-
91
-
92
-
93
-
94
-
95
-
96
-
97
-
98
-
99
-
100
-
101
-
102
-
103
-
104
-
105
-
106
-
107
-
108
-
109
-
110
-
111
-
112
-
113
-
114
-
115
-
116
-
117
-
118
-
119
-
120
-
121
-
122
-
123
-
124
-
125
-
126
-
127
-
128
-
129
-
130
-
131
-
132
-
133
-
134
-
135
-
136
-
137
-
138
-
139
-
140
-
141
-
142
-
143
-
144
-
145
-
146
-
147
-
148
-
149
-
150
-
151
-
152
-
153
-
154
-
155
-
156
 |
 |

48 Vodafone Group Plc Annual Report 2011
Financial position and resources continued
We provide returns to shareholders through dividends and have historically
paid dividends semi-annually, with a regular interim dividend in respect of
the first six months of the financial year payable in February and a final
dividend payable in August. The directors expect that we will continue to pay
dividends semi-annually.
In November 2010 the directors announced an interim dividend of 2.85
pence per share representing a 7.1% increase over last year’s interim
dividend. The directors are proposing a final dividend of 6.05 pence per
share representing a 7.1% increase over last year’s final dividend. Total
dividends for the year increased by 7.1% to 8.90 pence per share.
In May 2010 the directors issued a dividend per share growth target of at
least 7% per annum for each of the financial years in the period ending
31 March 2013, assuming no material adverse foreign exchange rate
movements. We expect that total dividends per share will therefore be no
less than 10.18p for the 2013 financial year. See page 44 for the assumptions
underlying this expectation.
Liquidity and capital resources
The major sources of Group liquidity for the 2011 and 2010 financial years
were cash generated from operations, dividends from associates and
borrowings through short-term and long-term issuances in the capital
markets. We do not use non-consolidated special purpose entities as a
source of liquidity or for other financing purposes.
Our key sources of liquidity for the foreseeable future are likely to be cash
generated from operations and borrowings through long-term and short-
term issuances in the capital markets as well as committed bank facilities.
Our liquidity and working capital may be affected by a material decrease in
cash flow due to factors such as reduced operating cash flow resulting from
further possible business disposals, increased competition, litigation, timing
of tax payments and the resolution of outstanding tax issues, regulatory
rulings, delays in the development of new services and networks, licence
and spectrum payments, inability to receive expected revenue from
the introduction of new services, reduced dividends from associates
and investments or increased dividend payments to non-controlling
shareholders. Please see the section titled “Principal risk factors and
uncertainties” on pages 45 and 46.
We are also party to a number of agreements that may result in a cash
outflow in future periods. These agreements are discussed further in
“Option agreements and similar arrangements” at the end of this section.
Wherever possible, surplus funds in the Group (except in Albania, Egypt, India
and Vodacom) are transferred to the centralised treasury department
through repayment of borrowings, deposits, investments, share purchases
and dividends. These are then loaned internally or contributed as equity to
fund our operations, used to retire external debt, invested externally or used
to pay dividends.
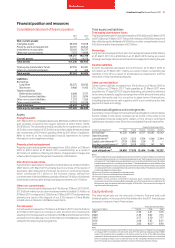
Cash ows
Free cash flow decreased by 2.7% to £7,049 million primarily due to higher
taxation payments and dividends to non-controlling shareholders in
subsidiaries partially offset by improved cash generated from operations
and lower payments for capital expenditure.
Cash generated by operations increased by 0.4% to £15,392 million primarily
driven by foreign exchange rate movements and working capital
improvements. Cash capital expenditure decreased by £328 million
primarily due to lower expenditure in India. We invested £2,982 million in
licences and spectrum including £1,725 million in India and £1,210 million
in Germany.
Payments for taxation increased by 14.3% to £2,597 million primarily due to
the absence of the one-time benefit of additional tax deductions which were
available in Italy in the previous year.
Dividends received from associates and investments were stable at
£1,509 million.
Net interest payments decreased by 5.5% to £1,328 million primarily due to
lower average net debt.
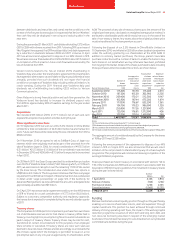
2011 2010
£m £m %
Cash generated by operations 15,392 15,337 0.4
Cash capital expenditure(1) (5,658) (5,986)
Disposal of intangible assets and
property, plant and equipment 51 48
Operating free cash flow 9,785 9,399 4.1
Taxation (2,597) (2,273)
Dividends received from associates
and investments(2) 1,509 1,577
Dividends paid to non-controlling
shareholders in subsidiaries (320) (56)
Interest received and paid (1,328) (1,406)
Free cash flow 7,049 7,241 (2.7)
Other amounts(3) 45 –
Licence and spectrum payments (2,982) (989)
Acquisitions and disposals(4) (183) (2,683)
Contributions from non-controlling
shareholders in subsidiaries(5) – 613
Equity dividends paid (4,468) (4,139)
Purchase of treasury shares (2,087) –
Foreign exchange 834 1,038
Other(6) 5,250 (174)
Net debt decrease 3,458 907
Opening net debt (33,316) (34,223)
Closing net debt (29,858) (33,316) (10.4)
Notes:
(1) Cash paid for purchase of property, plant and equipment and intangible assets, other than
licence and spectrum payments.
(2) Year ended 31 March 2011 includes £373 million (2010:£389 million) from our interest in SFR
and £1,024 million (2010: £1,034 million) from our interest in Verizon Wireless.
(3) Comprises items in respect of: the UK CFC settlement (£800 million), tax relating to the disposal
of China Mobile Limited (£208 million), the SoftBank disposal (£1,409 million) and the court
deposit made in respect of the India tax case (£356 million). The latter is included within the line
item “Purchase of interests in subsidiaries and joint ventures, net of cash acquired” in the
consolidated statement of cash flows.
(4) Year ended 31 March 2011 includes net cash and cash equivalents paid of £183 million (2010:
£1,777 million) and assumed debt of £nil (2010: £906 million).
(5) Year ended 31 March 2010 includes £613 million in relation to Qatar.
(6) Year ended 31 March 2011 includes £4,264 million in relation to the disposal of our 3.2% interest
in China Mobile Limited.
Dividends from associates and to non-controlling shareholders
Dividends from our associates are generally paid at the discretion of the
board of directors or shareholders of the individual operating and holding
companies and we have no rights to receive dividends except where
specified within certain of the Group’s shareholders’ agreements such as
with SFR, our associate in France. Similarly, we do not have existing
obligations under shareholders’ agreements to pay dividends to non-
controlling interest partners of our subsidiaries or joint ventures, except as
specified below.
Included in the dividends received from associates and investments is an
amount of £1,024 million (2010: £1,034 million) received from Verizon
Wireless. Until April 2005 Verizon Wireless’ distributions were determined
by the terms of the partnership agreement distribution policy and
comprised income distributions and tax distributions. Since April 2005
only tax distributions have been issued. Following the announcement of
Verizon Wireless’ acquisition of Alltel, certain additional tax distributions
were agreed in addition to the tax distributions required by the partnership
agreement. Taken together with recent revisions to the tax distribution
provisions in the partnership agreement, current projections forecast that
tax distributions will cover the US tax liabilities arising from our partnership
interest in Verizon Wireless.
Under the terms of the partnership agreement the Verizon Wireless board
has no obligation to effect additional distributions above the level of the
tax distributions. However, the Verizon Wireless board has agreed that it
will review distributions from Verizon Wireless on a regular basis. When
considering whether distributions will be made each year, the Verizon
Wireless board will take into account its debt position, the relationship