Vodafone 2011 Annual Report Download - page 45
Download and view the complete annual report
Please find page 45 of the 2011 Vodafone annual report below. You can navigate through the pages in the report by either clicking on the pages listed below, or by using the keyword search tool below to find specific information within the annual report.-
 1
1 -
2
-
3
-
4
-
5
-
6
-
7
-
8
-
9
-
10
-
11
-
12
-
13
-
14
-
15
-
16
-
17
-
18
-
19
-
20
-
21
-
22
-
23
-
24
-
25
-
26
-
27
-
28
-
29
-
30
-
31
-
32
-
33
-
34
-
 35
35 -
 36
36 -
 37
37 -
 38
38 -
 39
39 -
 40
40 -
 41
41 -
 42
42 -
 43
43 -
 44
44 -
 45
45 -
 46
46 -
 47
47 -
 48
48 -
 49
49 -
 50
50 -
 51
51 -
 52
52 -
 53
53 -
 54
54 -
 55
55 -
56
-
57
-
58
-
59
-
60
-
61
-
62
-
63
-
64
-
65
-
66
-
67
-
68
-
69
-
70
-
71
-
72
-
73
-
74
-
75
-
76
-
77
-
78
-
79
-
80
-
81
-
82
-
83
-
84
-
85
-
86
-
87
-
88
-
89
-
90
-
91
-
92
-
93
-
94
-
95
-
96
-
97
-
98
-
99
-
100
-
101
-
102
-
103
-
104
-
105
-
106
-
107
-
108
-
109
-
110
-
111
-
112
-
113
-
114
-
115
-
116
-
117
-
118
-
119
-
120
-
121
-
122
-
123
-
124
-
125
-
126
-
127
-
128
-
129
-
130
-
131
-
132
-
133
-
134
-
135
-
136
-
137
-
138
-
139
-
140
-
141
-
142
-
143
-
144
-
145
-
146
-
147
-
148
-
149
-
150
-
151
-
152
-
153
-
154
-
155
-
156
 |
 |

Vodafone Group Plc Annual Report 2011 43
Performance
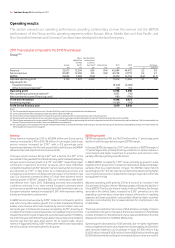
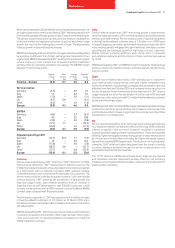
EBITDA increased by 38.3%, also benefiting from the full consolidation of
Vodacom and positive foreign exchange rate movements, offset in part by
the creation of the joint venture in Australia. On an organic basis EBITDA
increased by 5.5%(*) with EBITDA margin decreasing due to turnaround
investment in Ghana, the competitive pricing environment in India and the
impact of launching services in Qatar.
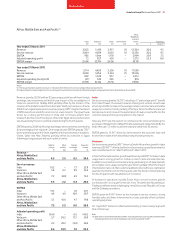
Organic M&A Foreign Reported
change activity exchange change
% pps pps %
Revenue –
Africa, Middle East
and Asia Pacific 6.1 25.2 12.3 43.6
Service revenue
India 14.7 – 3.2 17.9
Vodacom 4.6 112.0 38.8 155.4
Other 2.9 (3.3) 9.6 9.2
Africa, Middle East
and Asia Pacific 7.5 24.9 11.8 44.2
EBITDA
India 9.2 – 3.4 12.6
Vodacom 10.4 101.8 39.9 152.1
Other (4.8) (11.6) 7.5 (8.9)
Africa, Middle East
and Asia Pacific 5.5 20.5 12.3 38.3
Adjusted operating profit
India 30.7 – (7.4) 23.3
Vodacom 12.5 3.1 23.8 39.4
Other (19.7) (27.6) 5.1 (42.2)
Africa, Middle East
and Asia Pacific (0.3) (22.3) 11.2 (11.4)
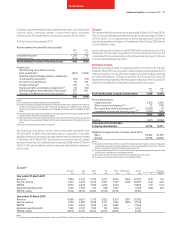
India
Service revenue grew by 14.7%(*) for the year, with fourth quarter growth of
6.5%(*) including a 0.3 percentage point(*) benefit from Indus Towers. The
contribution to India’s revenue growth from Indus Towers for the fourth
quarter was lower than in the third quarter as the fourth quarter represented
the first anniversary of significant revenue being earned from the network
sharing joint venture. Mobile service revenue growth was driven by the
increase in the customer base, with record net additions for the quarter
of 9.5 million, partially offset by ongoing competitive pressure on mobile
voice pricing. Customer penetration in the Indian mobile market reached
an estimated 50% at 31 March 2010 representing an increase of
16.0 percentage points compared to 31 March 2009.
EBITDA grew by 9.2%(*) driven by the increased customer base and the 37.6%
increase in total mobile minute usage during the year, with costs decreasing
as a percentage of service revenue despite the pressure on pricing. Network
expansion continued with the addition of 9,000 base stations by Indus
Towers and an additional 16,000 by Vodafone Essar.
Vodacom
Service revenue grew by 4.6%(*) driven by a robust performance in South
Africa offset by revenue declines in Tanzania and the Democratic Republic
of Congo. Data revenue increased by 32.9%(*) driven by increased
penetration of mobile broadband and higher mobile internet usage. The
introduction of prepaid customer registration in South Africa negatively
impacted customer growth in the year and mobile termination rate
reductions are expected to reduce growth in the 2011 financial year, with
the first reduction taking effect from 1 March 2010.
EBITDA increased by 10.4%(*) driven by the increase in service revenue and
lower direct costs and regulatory fees in South Africa.
Other Africa, Middle East and Asia Pacific
Service revenue increased by 2.9%(*) driven by the performance of Egypt
and Qatar. In Egypt service revenue grew by 1.3%(*) as pressure on voice
pricing and a 1.0% impact of retrospective mobile termination rate
reductions introduced in the fourth quarter was offset by 31% growth in the
average customer base and 64.2%(*) growth in data and fixed line revenue,
with data driven by increased penetration of mobile internet devices.
Having launched services in July 2009, Qatar increased its mobile customer
base to 465,000 customers at 31 March 2010, representing 28% of the
total population.
EBITDA declined 4.8%(*) with a 5.2% decline in EBITDA margin due to pricing,
recessionary pressures and the impact of start-up costs in Qatar offset in
part by efficiency savings.
On 9 June 2009 Vodafone Australia successfully completed its merger with
Hutchison 3G Australia to form a 50:50 joint venture, Vodafone Hutchison
Australia Pty Limited. Since the merger the joint venture has performed well
delivering 8% pro-forma service revenue growth in the fourth quarter and
cost synergies to date of £65 million, in line with management’s expectations.
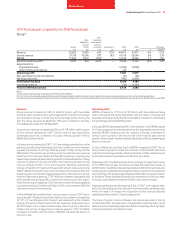
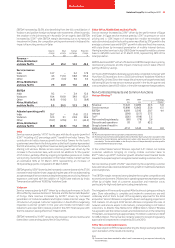
Non-Controlled Interests and Common Functions
Verizon Wireless(1)
2010 2009 % change
£m £m £ Organic
Revenue 17,222 14,085 22.3 5.0
Service revenue 15,898 12,862 23.6 6.3
EBITDA 6,689 5,543 20.7 4.4
Interest (298) (217) 37.3
Tax(2) (205) (198) 3.5
Non-controlling interests (80) (78) 2.6
Discontinued operations 93 57 63.2
Group’s share of result in
Verizon Wireless 4,112 3,542 16.1 8.0
Notes:
(1) All amounts represent the Group’s share unless otherwise stated.
(2) The Group’s share of the tax attributable to Verizon Wireless relates only to the corporate entities
held by the Verizon Wireless partnership and certain state taxes which are levied on the
partnership. The tax attributable to the Group’s share of the partnership’s pre-tax profit is
included within the Group tax charge.
In the United States Verizon Wireless reported 3.4(3) million net mobile
customer additions bringing its closing mobile customer base to
85.7(3) million, up 4.3%(3). Customer growth reflected recent market trends
towards the prepaid segment alongside market leading customer churn.
Service revenue growth of 6.3%(*) was driven by the expanding customer
base and robust data revenue derived from growth in multimedia handsets
and smartphones.
The EBITDA margin remained strong despite the tougher competitive and
economic environment. Efficiencies in operating expenses have been partly
offset by a higher level of customer acquisition and retention costs,
particularly for high-end devices including smartphones.
The integration of the recently acquired Alltel business is going according to
plan. Store rebranding is complete and network conversions are well
underway and on track. As part of the regulatory approval for the Alltel
acquisition, Verizon Wireless is required to divest overlapping properties in
105 markets. On 26 April 2010 Verizon Wireless completed the sale of
network and licence assets in 26 markets, corresponding to 0.9 million
customers, to Atlantic Tele-Network for US$0.2 billion. Verizon Wireless
has agreed to sell the network assets and mobile licences in the remaining
79 markets, corresponding to approximately 1.5 million customers, to AT&T
for US$2.4 billion. This transaction remains subject to receipt of regulatory
approval and is expected to complete by 30 June 2010.
Other Non-Controlled Interests
The share of profit in SFR increased reflecting the foreign exchange benefits
upon translation of the results into sterling.
Note:
(3) Customers have been restated to reflect retail customers only, as reported externally by
Verizon Wireless.