Vodafone 2011 Annual Report Download - page 39
Download and view the complete annual report
Please find page 39 of the 2011 Vodafone annual report below. You can navigate through the pages in the report by either clicking on the pages listed below, or by using the keyword search tool below to find specific information within the annual report.-
 1
1 -
2
-
3
-
4
-
5
-
6
-
7
-
8
-
9
-
10
-
11
-
12
-
13
-
14
-
15
-
16
-
17
-
18
-
19
-
20
-
21
-
22
-
23
-
24
-
25
-
26
-
27
-
28
-
 29
29 -
 30
30 -
 31
31 -
 32
32 -
 33
33 -
 34
34 -
 35
35 -
 36
36 -
 37
37 -
 38
38 -
 39
39 -
 40
40 -
 41
41 -
 42
42 -
 43
43 -
 44
44 -
 45
45 -
 46
46 -
 47
47 -
 48
48 -
 49
49 -
50
-
51
-
52
-
53
-
54
-
55
-
56
-
57
-
58
-
59
-
60
-
61
-
62
-
63
-
64
-
65
-
66
-
67
-
68
-
69
-
70
-
71
-
72
-
73
-
74
-
75
-
76
-
77
-
78
-
79
-
80
-
81
-
82
-
83
-
84
-
85
-
86
-
87
-
88
-
89
-
90
-
91
-
92
-
93
-
94
-
95
-
96
-
97
-
98
-
99
-
100
-
101
-
102
-
103
-
104
-
105
-
106
-
107
-
108
-
109
-
110
-
111
-
112
-
113
-
114
-
115
-
116
-
117
-
118
-
119
-
120
-
121
-
122
-
123
-
124
-
125
-
126
-
127
-
128
-
129
-
130
-
131
-
132
-
133
-
134
-
135
-
136
-
137
-
138
-
139
-
140
-
141
-
142
-
143
-
144
-
145
-
146
-
147
-
148
-
149
-
150
-
151
-
152
-
153
-
154
-
155
-
156
 |
 |

Vodafone Group Plc Annual Report 2011 37
Performance
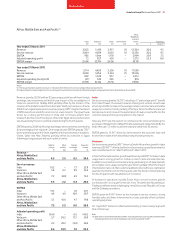
Africa, Middle East and Asia Pacic(1)
Africa,
Middle East
and Asia
India Vodacom Other Eliminations Pacific % change
£m £m £m £m £m £ Organic(2)
Year ended 31 March 2011
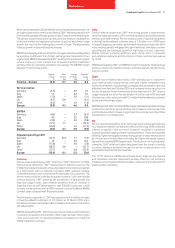
Revenue 3,855 5,479 3,971 (1) 13,304 20.0 9.5
Service revenue 3,804 4,839 3,650 (1) 12,292 20.0 9.5
EBITDA 985 1,844 1,170 – 3,999 20.7 7.5
Adjusted operating profit 15 827 430 – 1,272 55.5 8.6
EBITDA margin 25.6% 33.7% 29.5% 30.1%
Year ended 31 March 2010
Revenue 3,114 4,450 3,526 (1) 11,089
Service revenue 3,069 3,954 3,224 (1) 10,246
EBITDA 807 1,528 977 – 3,312
Adjusted operating (loss)/profit (37) 520 335 – 818
EBITDA margin 25.9% 34.3% 27.7% 29.9%
Notes:
(1) The Group revised its segment structure on 1 October 2010. See note 3 to the consolidated financial statements.
(2) Organic growth includes Vodacom at the current level of ownership and excludes Australia following the merger with Hutchison 3G Australia on 9 June 2009.
Revenue grew by 20.0% with an 8.5 percentage point benefit from foreign
exchange rate movements and the full year impact of the consolidation of
Vodacom results from 18 May 2009 partially offset by the impact of the
creation of the Vodafone Hutchison Australia (‘VHA’) joint venture on 9 June
2009. On an organic basis service revenue grew by 9.5%(*) despite the impact
of MTR reductions and difficult economic environments. The growth was
driven by a strong performance in India and continued growth from
Vodacom and the rest of the region, other than Egypt where performance
was impacted by the socio-political unrest during the fourth quarter.
EBITDA grew by 20.8% with foreign exchange rate movements contributing
8.0 percentage points of growth. On an organic basis EBITDA grew by 7.5%(*)
driven primarily by growth in India, together with improvements in Vodacom,
Ghana, Qatar and New Zealand, partially offset by a decline in Egypt
following pricing pressure and socio-political unrest.
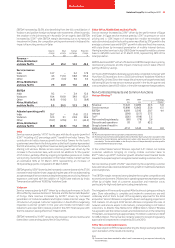
Organic M&A Foreign Reported
change activity exchange change
% pps pps %
Revenue –
Africa, Middle East
and Asia Pacific 9.5 2.0 8.5 20.0
Service revenue
India 16.2 – 7.7 23.9
Vodacom 5.8 6.7 9.9 22.4
Other Africa, Middle East
and Asia Pacific 7.2 (0.9) 6.9 13.2
Africa, Middle East
and Asia Pacific 9.5 2.2 8.3 20.0
EBITDA
India 15.1 – 7.0 22.1
Vodacom 4.9 4.9 10.9 20.7
Other Africa, Middle East
and Asia Pacific 5.1 10.6 4.1 19.8
Africa, Middle East
and Asia Pacific 7.5 5.3 8.0 20.8
Adjusted operating profit
India 134.0 – 6.5 140.5
Vodacom 5.7 38.2 15.1 59.0
Other Africa, Middle East
and Asia Pacific 2.2 29.2 (3.0) 28.4
Africa, Middle East
and Asia Pacific 8.6 39.9 7.0 55.5
India
Service revenue grew by 16.2%(*) including a 1.7 percentage point(*) benefit
from Indus Towers, the Group’s network sharing joint venture. Growth was
driven by a 39.0% increase in the average mobile customer base and stable
usage per customer trends, partially offset by a fall in the effective rate per
minute due to an increase in the penetration of lower priced tariffs into the
customer base and strong competition in the market.
February 2011 saw the launch of commercial 3G services following the
purchase of 3G spectrum in May 2010 and subsequent network build. By the
end of the year 1.5 million customers had activated their 3G access.
EBITDA grew by 15.1%(*) driven by the increase in the customer base and
economies of scale which absorbed pricing and cost pressures.
Vodacom
Service revenue grew by 5.8%(*) driven by South Africa where growth in data
revenue of 35.9%(*)(1) offset a decline in voice revenue caused by termination
rate cuts effective from 1 March 2010 and 1 March 2011.
In South Africa data revenue growth was driven by a 48.9%(*) increase in data
usage due to strong growth in mobile connect cards and smartphones.
In addition, successful commercial activity, particularly in off-peak periods,
drove higher voice usage during the year which partially offset the impact
of termination rate cuts. Net customer additions returned to pre-registration
levels for the first time in the third quarter, with the trend continuing during
the fourth quarter with net additions of 1.2 million.
In Vodacom’s operations outside South Africa service revenue growth
continued with strong performances from Tanzania and Mozambique.
Trading conditions remain challenging in the Democratic Republic of Congo
and the Gateway operations.
EBITDA grew by 4.9%(*) driven by the increase in service revenue, strong
handset sales and lower interconnection costs, partially offset by higher
operating expenses.
On 1 April 2011 Vodacom refreshed its branding to more closely align with
that of the Group.
Note:
(1) Data revenue in South Africa grew by 41.8%(*). Excluding the impact of reclassifications between
messaging and data revenue during the year, data revenue grew by 35.9%(*).