Vodafone 2011 Annual Report Download - page 108
Download and view the complete annual report
Please find page 108 of the 2011 Vodafone annual report below. You can navigate through the pages in the report by either clicking on the pages listed below, or by using the keyword search tool below to find specific information within the annual report.-
 1
1 -
2
-
3
-
4
-
5
-
6
-
7
-
8
-
9
-
10
-
11
-
12
-
13
-
14
-
15
-
16
-
17
-
18
-
19
-
20
-
21
-
22
-
23
-
24
-
25
-
26
-
27
-
28
-
29
-
30
-
31
-
32
-
33
-
34
-
35
-
36
-
37
-
38
-
39
-
40
-
41
-
42
-
43
-
44
-
45
-
46
-
47
-
48
-
49
-
50
-
51
-
52
-
53
-
54
-
55
-
56
-
57
-
58
-
59
-
60
-
61
-
62
-
63
-
64
-
65
-
66
-
67
-
68
-
69
-
70
-
71
-
72
-
73
-
74
-
75
-
76
-
77
-
78
-
79
-
80
-
81
-
82
-
83
-
84
-
85
-
86
-
87
-
88
-
89
-
90
-
91
-
92
-
93
-
94
-
95
-
96
-
97
-
 98
98 -
 99
99 -
 100
100 -
 101
101 -
 102
102 -
 103
103 -
 104
104 -
 105
105 -
 106
106 -
 107
107 -
 108
108 -
 109
109 -
 110
110 -
 111
111 -
 112
112 -
 113
113 -
 114
114 -
 115
115 -
 116
116 -
 117
117 -
 118
118 -
119
-
120
-
121
-
122
-
123
-
124
-
125
-
126
-
127
-
128
-
129
-
130
-
131
-
132
-
133
-
134
-
135
-
136
-
137
-
138
-
139
-
140
-
141
-
142
-
143
-
144
-
145
-
146
-
147
-
148
-
149
-
150
-
151
-
152
-
153
-
154
-
155
-
156
 |
 |
106 Vodafone Group Plc Annual Report 2011
Notes to the consolidated nancial statements continued
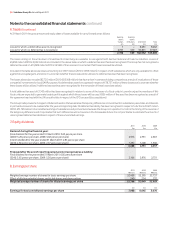
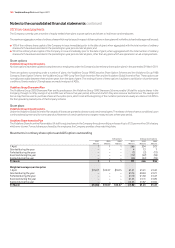
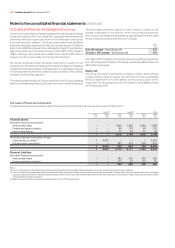
16. Inventory
2011 2010
£m £m
Goods held for resale 537 433
Inventory is reported net of allowances for obsolescence, an analysis of which is as follows:
2011 2010 2009
£m £m £m
1 April 120 111 118
Exchange movements (1) 5 13
Amounts (credited)/charged to the income statement (2) 4 (20)
31 March 117 120 111
Cost of sales includes amounts related to inventory amounting to £5,878 million (2010: £5,268 million; 2009: £4,853 million).
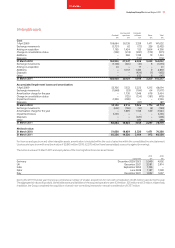
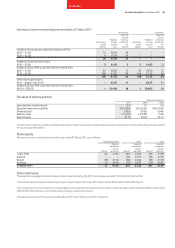
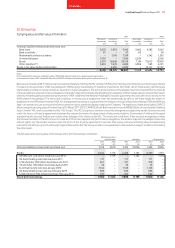
17. Trade and other receivables
2011 2010
£m £m
Included within non-current assets:
Trade receivables 92 59
Other receivables 1,719 678
Prepayments and accrued income 137 148
Derivative financial instruments 1,929 1,946
3,877 2,831
Included within current assets:
Trade receivables 4,185 4,008
Amounts owed by associates 53 24
Other receivables 1,606 1,122
Prepayments and accrued income 3,299 3,448
Derivative financial instruments 116 182
9,259 8,784
The Group’s trade receivables are stated after allowances for bad and doubtful debts based on management’s assessment of creditworthiness, an analysis
of which is as follows:
2011 2010 2009
£m £m £m
1 April 929 874 664
Exchange movements (30) (27) 101
Amounts charged to administrative expenses 460 465 423
Trade receivables written off (353) (383) (314)
31 March 1,006 929 874
The carrying amounts of trade and other receivables approximate their fair value. Trade and other receivables are predominantly non-interest bearing.
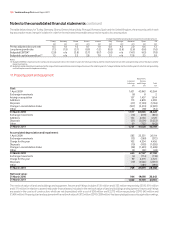
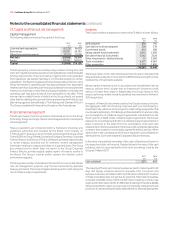
2011 2010
£m £m
Included within “Derivative financial instruments”:
Fair value through the income statement (held for trading):
Interest rate swaps 1,292 1,031
Foreign exchange swaps 99 132
1,391 1,163
Fair value hedges:
Interest rate swaps 654 965
2,045 2,128
The fair values of these financial instruments are calculated by discounting the future cash flows to net present values using appropriate market interest
and foreign currency rates prevailing at 31 March.