Vodafone 2011 Annual Report Download - page 37
Download and view the complete annual report
Please find page 37 of the 2011 Vodafone annual report below. You can navigate through the pages in the report by either clicking on the pages listed below, or by using the keyword search tool below to find specific information within the annual report.-
 1
1 -
2
-
3
-
4
-
5
-
6
-
7
-
8
-
9
-
10
-
11
-
12
-
13
-
14
-
15
-
16
-
17
-
18
-
19
-
20
-
21
-
22
-
23
-
24
-
25
-
26
-
 27
27 -
 28
28 -
 29
29 -
 30
30 -
 31
31 -
 32
32 -
 33
33 -
 34
34 -
 35
35 -
 36
36 -
 37
37 -
 38
38 -
 39
39 -
 40
40 -
 41
41 -
 42
42 -
 43
43 -
 44
44 -
 45
45 -
 46
46 -
 47
47 -
48
-
49
-
50
-
51
-
52
-
53
-
54
-
55
-
56
-
57
-
58
-
59
-
60
-
61
-
62
-
63
-
64
-
65
-
66
-
67
-
68
-
69
-
70
-
71
-
72
-
73
-
74
-
75
-
76
-
77
-
78
-
79
-
80
-
81
-
82
-
83
-
84
-
85
-
86
-
87
-
88
-
89
-
90
-
91
-
92
-
93
-
94
-
95
-
96
-
97
-
98
-
99
-
100
-
101
-
102
-
103
-
104
-
105
-
106
-
107
-
108
-
109
-
110
-
111
-
112
-
113
-
114
-
115
-
116
-
117
-
118
-
119
-
120
-
121
-
122
-
123
-
124
-
125
-
126
-
127
-
128
-
129
-
130
-
131
-
132
-
133
-
134
-
135
-
136
-
137
-
138
-
139
-
140
-
141
-
142
-
143
-
144
-
145
-
146
-
147
-
148
-
149
-
150
-
151
-
152
-
153
-
154
-
155
-
156
 |
 |

Vodafone Group Plc Annual Report 2011 35
Performance
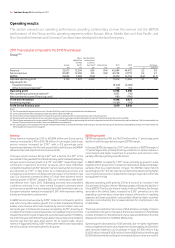
increases in government bond rates together with lower cash flows within
business plans, reflecting weaker country-level macro economic
environments. The impairment loss in the prior year was £2,100 million.
Profit for the year decreased by 8.7%.
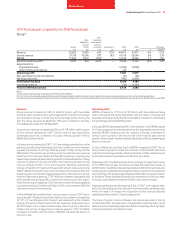
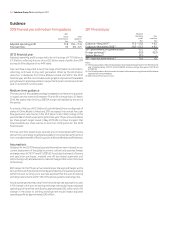
Net investment income/(financing costs)
2011 2010
£m £m
Investment income 1,309 716
Financing costs (429) (1,512)
Net investment income/(financing costs) 880 (796)
Analysed as:
Net financing costs before income
from investments (852) (1,024)
Potential interest charges arising on settlement
of outstanding tax issues(1) (46) (23)
Income from investments 83 145
Foreign exchange(2) 256 (1)
Equity put rights and similar arrangements(3) 95 (94)
Interest related to the settlement of tax cases(4) 872 201
Disposal of SoftBank financial instruments(5) 472 –
880 (796)
Notes:
(1) Excluding interest credits related a tax case settlement.
(2) Comprises foreign exchange rate differences reflected in the income statement in relation to
certain intercompany balances and the foreign exchange rate differences on financial
instruments received as consideration on the disposal of Vodafone Japan to SoftBank in April
2006.
(3) Includes foreign exchange rate movements, accretion expense and fair value charges. Further
details of these options are provided on page 51.
(4) The £872 million in the year ended 31 March 2011 relates to the settlement of a tax case and the
£201 million in the year ended 31 March 2010 relates to the settlement of the German tax loss
claim.
(5) See “Other significant transactions” on page 49.
Net financing costs before income from investments decreased from
£1,024 million to £852 million primarily due to a reduction in net debt,
partially offset by an increase in average interest rates for debt denominated
in US dollars. At 31 March 2011 the provision for potential interest charges
arising on settlement of outstanding tax issues was £398 million (31 March
2010: £1,312 million), with the reduction primarily reflecting the settlement
of a tax case.
Taxation
The adjusted effective tax rate for the year ended 31 March 2011 was 24.5%.
This is in line with the adjusted effective tax rate for the year ended 31 March
2010 of 24.0%. Tax on adjustments to derive adjusted profit before tax
includes tax payable on the gain on the disposal of the Group’s 3.2% interest
in China Mobile Limited.
Income tax expense includes a credit of £929 million arising as a result of the
settlement of a tax case in July 2010. For further details see note 4 to the
consolidated financial statements in the half-year financial report for the six
months ended 30 September 2010.
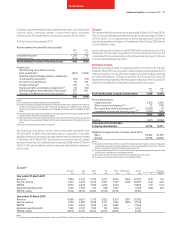
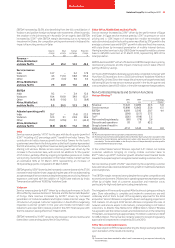
Earnings per share
Adjusted earnings per share increased by 4.0% to 16.75 pence for the year
ended 31 March 2011 due to growth in adjusted earnings and a reduction in
shares arising from the Group’s share buyback programme. Basic earnings
per share decreased to 15.2 pence primarily due to the £6,150 million of
impairment charges partially offset by a gain on disposal of the Group’s 3.2%
interest in China Mobile Limited and the settlement of a tax case.
2011 2010
£m £m
Profit attributable to equity shareholders 7,968 8,645
Pre-tax adjustments:
Impairment loss 6,150 2,100
Other income and expense(1)(4) 72 (114)
Non-operating income and expense(2)(4) (3,022) 10
Investment income and financing costs(3)(4) (1,695) (106)
1,505 1,890
Taxation (697) (2,064)
Adjusted profit attributable
to equity shareholders 8,776 8,471
Weighted average number of shares outstanding
Basic 52,408 52,595
Diluted 52,748 52,849
Notes:
(1) The year ended 31 March 2011 includes £56 million representing the net loss on disposal of
certain Alltel investments by Verizon Wireless. This is included within the line item “Share of
results in associates” in the consolidated income statement.
(2) The year ended 31 March 2011 includes £3,019 million representing the profit arising on the sale
of the Group’s 3.2% interest in China Mobile Limited.
(3) See notes 2, 3, 4 and 5 in ”Net investment income/(financing costs)” above.
(4) These amounts comprise ‘Other net income’ of £5,342 million
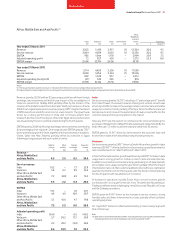
Europe(1)
Germany Italy Spain UK Other Eliminations Europe % change
£m £m £m £m £m £m £m £ Organic
Year ended 31 March 2011
Revenue 7,900 5,722 5,133 5,271 8,253 (264) 32,015 (2.5) 0.6
Service revenue 7,471 5,432 4,735 4,931 7,787 (259) 30,097 (3.4) (0.4)
EBITDA 2,952 2,643 1,562 1,233 2,433 – 10,823 (7.1) (3.7)
Adjusted operating profit 1,548 1,903 915 348 1,012 – 5,726 (9.8) (6.1)
EBITDA margin 37.4% 46.2% 30.4% 23.4% 29.5% 33.8%
Year ended 31 March 2010
Revenue 8,008 6,027 5,713 5,025 8,357 (297) 32,833
Service revenue 7,722 5,780 5,298 4,711 7,943 (295) 31,159
EBITDA 3,122 2,843 1,956 1,141 2,582 – 11,644
Adjusted operating profit 1,695 2,107 1,310 155 1,084 – 6,351
EBITDA margin 39.0% 47.2% 34.2% 22.7% 30.9% 35.5%
Note:
(1) The Group revised its segment structure on 1 October 2010. See note 3 to the consolidated financial statements.