Vodafone 2011 Annual Report Download - page 122
Download and view the complete annual report
Please find page 122 of the 2011 Vodafone annual report below. You can navigate through the pages in the report by either clicking on the pages listed below, or by using the keyword search tool below to find specific information within the annual report.-
 1
1 -
2
-
3
-
4
-
5
-
6
-
7
-
8
-
9
-
10
-
11
-
12
-
13
-
14
-
15
-
16
-
17
-
18
-
19
-
20
-
21
-
22
-
23
-
24
-
25
-
26
-
27
-
28
-
29
-
30
-
31
-
32
-
33
-
34
-
35
-
36
-
37
-
38
-
39
-
40
-
41
-
42
-
43
-
44
-
45
-
46
-
47
-
48
-
49
-
50
-
51
-
52
-
53
-
54
-
55
-
56
-
57
-
58
-
59
-
60
-
61
-
62
-
63
-
64
-
65
-
66
-
67
-
68
-
69
-
70
-
71
-
72
-
73
-
74
-
75
-
76
-
77
-
78
-
79
-
80
-
81
-
82
-
83
-
84
-
85
-
86
-
87
-
88
-
89
-
90
-
91
-
92
-
93
-
94
-
95
-
96
-
97
-
98
-
99
-
100
-
101
-
102
-
103
-
104
-
105
-
106
-
107
-
108
-
109
-
110
-
111
-
 112
112 -
 113
113 -
 114
114 -
 115
115 -
 116
116 -
 117
117 -
 118
118 -
 119
119 -
 120
120 -
 121
121 -
 122
122 -
 123
123 -
 124
124 -
 125
125 -
 126
126 -
 127
127 -
 128
128 -
 129
129 -
 130
130 -
 131
131 -
 132
132 -
133
-
134
-
135
-
136
-
137
-
138
-
139
-
140
-
141
-
142
-
143
-
144
-
145
-
146
-
147
-
148
-
149
-
150
-
151
-
152
-
153
-
154
-
155
-
156
 |
 |
120 Vodafone Group Plc Annual Report 2011
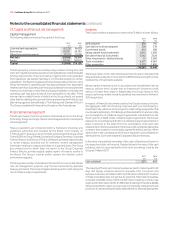
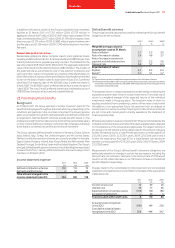
25. Trade and other payables
2011 2010
£m £m
Included within non-current liabilities:
Other payables 80 76
Accruals and deferred income 329 379
Derivative financial instruments 395 361
804 816
Included within current liabilities:
Trade payables 4,453 3,254
Amounts owed to associates 23 17
Other taxes and social security payable 1,140 998
Other payables 520 650
Accruals and deferred income 8,409 9,064
Derivative financial instruments 153 99
14,698 14,082
The carrying amounts of trade and other payables approximate their fair value. The fair values of the derivative financial instruments are calculated by
discounting the future cash flows to net present values using appropriate market interest and foreign currency rates prevailing at 31 March.
2011 2010
£m £m
Included within “Derivative financial instruments”:
Fair value through the income statement (held for trading):
Interest rate swaps 342 330
Foreign exchange swaps 153 95
495 425
Fair value hedges:
Interest rate swaps 53 35
548 460
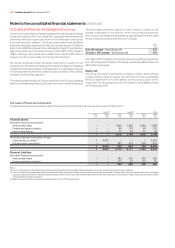
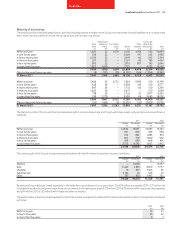
26. Reconciliation of net cash ow from operating activities
2011 2010 2009
£m £m £m
Profit for the financial year 7,870 8,618 3,080
Adjustments for:
Share-based payments 156 150 128
Depreciation and amortisation 7,876 7,910 6,814
Loss on disposal of property, plant and equipment 91 101 10
Share of result in associates (5,059) (4,742) (4,091)
Impairment losses 6,150 2,100 5,900
Other income and expense 16 (114) –
Non-operating income and expense (3,022) 10 44
Investment income (1,309) (716) (795)
Financing costs 429 1,512 2,419
Income tax expense 1,628 56 1,109
(Increase)/decrease in inventory (107) 2 81
(Increase)/decrease in trade and other receivables (387) (714) 80
Increase/(decrease) in trade and other payables 1,060 1,164 (145)
Cash generated by operations 15,392 15,337 14,634
Tax paid (3,397) (2,273) (2,421)
Net cash flow from operating activities 11,995 13,064 12,213
Notes to the consolidated nancial statements continued