Vodafone 2011 Annual Report Download - page 31
Download and view the complete annual report
Please find page 31 of the 2011 Vodafone annual report below. You can navigate through the pages in the report by either clicking on the pages listed below, or by using the keyword search tool below to find specific information within the annual report.
Vodafone Group Plc Annual Report 2011 29
Business review
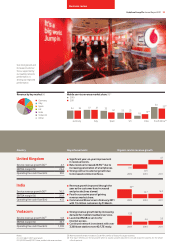
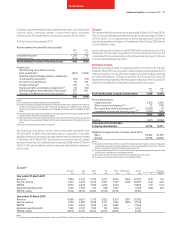
Country Organic service revenue growthKey achievements
■Significant year-on-year improvement
in revenue trends.
■Data revenue increased 28.5%(*) due to
increasing penetration of smartphones.
■Strong contract customer growth due
to increased commercial focus.
■Revenue growth improved through the
year as the customer base increased
and price declines slowed.
■Fourth successive year of gaining
revenue market share.
■Commenced 3G services in February 2011
with 1.5 million customers by 31 March.
■Strong revenue growth led by increasing
demand for mobile broadband services.
■Launched WebBox service for
internet access.
■Continued network investment with over
3,200 base stations now 4G/LTE ready.
Mobile service revenue market share (%)(1)
2010
2011
United Kingdom
India
Service revenue growth (%)(*) 16.2
EBITDA margin (%) 25.6
Operating free cash flow (£m) 433
Service revenue growth (%)(*) 5.8
EBITDA margin (%) 33.7
Operating free cash flow (£m) 1,339
Service revenue growth (%)(*) 4.7
EBITDA margin (%) 23.4
Operating free cash flow (£m) 950
Vodacom
Germany Italy Spain
34 34 37 37
19(2)
32
2009 2010 2011
2009 2010 2011
2009 2010 2011
25
33
18
54
25
UK
53(2)
South Africa(3)
India
(1.1)
33(4)
13.8
(4.7)
14.7
4.6
4.7
16.2
5.8
Notes:
(1) At 31 March (2011 estimated).
(2) Q3 2010 and Q3 2011 data; mobile total revenue share.
Revenue by key market (%)
Germany
Italy
Spain
UK
India
Vodacom
Other
12
11
11
8
12
29
17
Our strong brand and
increased customer
focus, supported by
our leading network
performance, is
driving our improved
performance.
(3) Market share information relates to South Africa which is Vodacom’s largest business.
(4) This figure reflects pro-forma growth which is organic growth adjusted to include acquired business for the whole
of both periods.


