Vodafone 2011 Annual Report Download - page 104
Download and view the complete annual report
Please find page 104 of the 2011 Vodafone annual report below. You can navigate through the pages in the report by either clicking on the pages listed below, or by using the keyword search tool below to find specific information within the annual report.-
 1
1 -
2
-
3
-
4
-
5
-
6
-
7
-
8
-
9
-
10
-
11
-
12
-
13
-
14
-
15
-
16
-
17
-
18
-
19
-
20
-
21
-
22
-
23
-
24
-
25
-
26
-
27
-
28
-
29
-
30
-
31
-
32
-
33
-
34
-
35
-
36
-
37
-
38
-
39
-
40
-
41
-
42
-
43
-
44
-
45
-
46
-
47
-
48
-
49
-
50
-
51
-
52
-
53
-
54
-
55
-
56
-
57
-
58
-
59
-
60
-
61
-
62
-
63
-
64
-
65
-
66
-
67
-
68
-
69
-
70
-
71
-
72
-
73
-
74
-
75
-
76
-
77
-
78
-
79
-
80
-
81
-
82
-
83
-
84
-
85
-
86
-
87
-
88
-
89
-
90
-
91
-
92
-
93
-
 94
94 -
 95
95 -
 96
96 -
 97
97 -
 98
98 -
 99
99 -
 100
100 -
 101
101 -
 102
102 -
 103
103 -
 104
104 -
 105
105 -
 106
106 -
 107
107 -
 108
108 -
 109
109 -
 110
110 -
 111
111 -
 112
112 -
 113
113 -
 114
114 -
115
-
116
-
117
-
118
-
119
-
120
-
121
-
122
-
123
-
124
-
125
-
126
-
127
-
128
-
129
-
130
-
131
-
132
-
133
-
134
-
135
-
136
-
137
-
138
-
139
-
140
-
141
-
142
-
143
-
144
-
145
-
146
-
147
-
148
-
149
-
150
-
151
-
152
-
153
-
154
-
155
-
156
 |
 |

102 Vodafone Group Plc Annual Report 2011
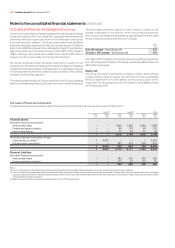
Notes to the consolidated nancial statements continued
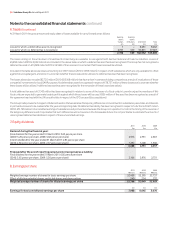
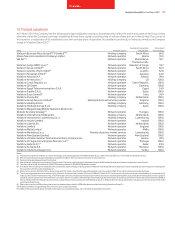
The table below shows, for Turkey, Germany, Ghana, Greece, Ireland, Italy, Portugal, Romania, Spain and the United Kingdom, the amount by which each
key assumption must change in isolation in order for the estimated recoverable amount to be equal to its carrying value.
Change required for carrying value to equal the recoverable amount
Turkey Germany Ghana Greece Ireland Italy Portugal Romania Spain UK
pps pps pps pps pps pps pps pps pps pps
Pre-tax adjusted discount rate 0.5 1.8 1.0 0.7 1.0 0.8 4.5 2.0 0.6 1.3
Long-term growth rate (1.1) (1.9) (5.1) (0.9) (1.2) (0.8) (5.6) (2.6) (0.6) (1.6)
Budgeted EBITDA(1) (2.0) n/a (2.8) (3.7) (8.7) (5.0) n/a (14.1) (4.5) (7.8)
Budgeted capital expenditure(2) 1.5 n/a 2.5 2.8 7.0 5.1 n/a 13.8 3.5 5.8
Notes:
(1) Budgeted EBITDA is expressed as the compound annual growth rates in the initial ten years for Turkey and Ghana and the initial five years for all other cash generating units of the plans used for
impairment testing.
(2) Budgeted capital expenditure is expressed as the range of capital expenditure as a percentage of revenue in the initial ten years for Turkey and Ghana and the initial five years for all other cash generating
units of the plans used for impairment testing.
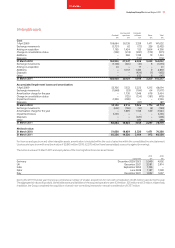
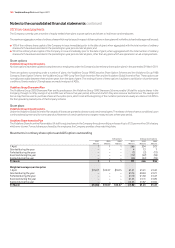
11. Property, plant and equipment
Equipment,
Land and fixtures
buildings and fittings Total
£m £m £m
Cost:
1 April 2009 1,421 43,943 45,364
Exchange movements (6) 8 2
Arising on acquisition 157 1,457 1,614
Additions 115 4,878 4,993
Disposals (27) (1,109) (1,136)
Change in consolidation status (107) (2,274) (2,381)
Other 24 (58) (34)
31 March 2010 1,577 46,845 48,422
Exchange movements (16) (678) (694)
Additions 122 4,604 4,726
Disposals (21) (3,001) (3,022)
Other 69 (732) (663)
31 March 2011 1,731 47,038 48,769
Accumulated depreciation and impairment:
1 April 2009 583 25,531 26,114
Exchange movements (12) (260) (272)
Charge for the year 102 4,354 4,456
Disposals (10) (995) (1,005)
Change in consolidation status (28) (1,461) (1,489)
Other (2) (22) (24)
31 March 2010 633 27,147 27,780
Exchange movements (4) (114) (118)
Charge for the year 99 4,273 4,372
Disposals (19) (2,942) (2,961)
Other – (485) (485)
31 March 2011 709 27,879 28,588
Net book value:
31 March 2010 944 19,698 20,642
31 March 2011 1,022 19,159 20,181
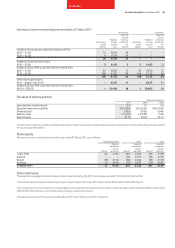
The net book value of land and buildings and equipment, fixtures and fittings includes £131 million and £155 million respectively (2010: £91 million
and £111 million) in relation to assets held under finance leases. Included in the net book value of land and buildings and equipment, fixtures and fittings
are assets in the course of construction, which are not depreciated, with a cost of £38 million and £2,375 million respectively (2010: £45 million and
£1,496 million). Property, plant and equipment with a net book value of £972 million (2010: £389 million) has been pledged as security against borrowings.