Vodafone 2011 Annual Report Download - page 118
Download and view the complete annual report
Please find page 118 of the 2011 Vodafone annual report below. You can navigate through the pages in the report by either clicking on the pages listed below, or by using the keyword search tool below to find specific information within the annual report.-
 1
1 -
2
-
3
-
4
-
5
-
6
-
7
-
8
-
9
-
10
-
11
-
12
-
13
-
14
-
15
-
16
-
17
-
18
-
19
-
20
-
21
-
22
-
23
-
24
-
25
-
26
-
27
-
28
-
29
-
30
-
31
-
32
-
33
-
34
-
35
-
36
-
37
-
38
-
39
-
40
-
41
-
42
-
43
-
44
-
45
-
46
-
47
-
48
-
49
-
50
-
51
-
52
-
53
-
54
-
55
-
56
-
57
-
58
-
59
-
60
-
61
-
62
-
63
-
64
-
65
-
66
-
67
-
68
-
69
-
70
-
71
-
72
-
73
-
74
-
75
-
76
-
77
-
78
-
79
-
80
-
81
-
82
-
83
-
84
-
85
-
86
-
87
-
88
-
89
-
90
-
91
-
92
-
93
-
94
-
95
-
96
-
97
-
98
-
99
-
100
-
101
-
102
-
103
-
104
-
105
-
106
-
107
-
 108
108 -
 109
109 -
 110
110 -
 111
111 -
 112
112 -
 113
113 -
 114
114 -
 115
115 -
 116
116 -
 117
117 -
 118
118 -
 119
119 -
 120
120 -
 121
121 -
 122
122 -
 123
123 -
 124
124 -
 125
125 -
 126
126 -
 127
127 -
 128
128 -
129
-
130
-
131
-
132
-
133
-
134
-
135
-
136
-
137
-
138
-
139
-
140
-
141
-
142
-
143
-
144
-
145
-
146
-
147
-
148
-
149
-
150
-
151
-
152
-
153
-
154
-
155
-
156
 |
 |

116 Vodafone Group Plc Annual Report 2011
Notes to the consolidated nancial statements continued
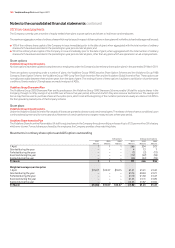
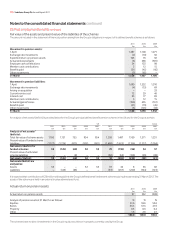
22. Borrowings continued
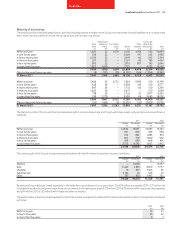
Interest rate and currency of borrowings
Total Floating rate Fixed rate Other
borrowings borrowings borrowings(1) borrowings(2)
Currency £m £m £m £m
Sterling 2,831 906 1,925 –
Euro 12,361 4,198 8,163 –
US dollar 16,030 9,488 3,352 3,190
Japanese yen 807 807 – –
Other 6,252 2,920 3,332 –
31 March 2011 38,281 18,319 16,772 3,190
Sterling 3,022 3,022 – –
Euro 14,244 9,429 4,815 –
US dollar 15,195 7,329 4,461 3,405
Japanese yen 2,605 2,605 – –
Other 4,729 4,105 624 –
31 March 2010 39,795 26,490 9,900 3,405
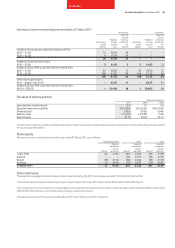
Notes:
(1) The weighted average interest rate for the Group’s sterling denominated fixed rate borrowings
is 5.7% (2010: n/a). The weighted average time for which these rates are fixed is 5.4 years (2010:
n/a). The weighted average interest rate for the Group’s euro denominated fixed rate borrowings
is 4.3% (2010: 5.3%). The weighted average time for which the rates are fixed is 3.8 years (2010:
3.4 years). The weighted average interest rate for the Group’s US dollar denominated fixed rate
borrowings is 5.4% (2010: 5.5%). The weighted average time for which the rates are fixed is 9.7
years (2010: 12.3 years). The weighted average interest rate for the Group’s other currency fixed
rate borrowings is 9.2% (2010: 10.1%). The weighted average time for which the rates are fixed is
2.0 years (2010: 1.5 years).
(2) Other borrowings of £3,190 million (2010: £3,405 million) are the liabilities arising under options
over direct and indirect interests in Vodafone Essar.
The figures shown in the tables above take into account interest rate swaps
used to manage the interest rate profile of financial liabilities. Interest on
floating rate borrowings is generally based on national LIBOR equivalents or
government bond rates in the relevant currencies.
At 31 March 2011 the Group had entered into foreign exchange contracts to
decrease its sterling, US dollar and other currency borrowings above by
£10,198 million and amounts equal to £374 million and £105 million
respectively, and to increase its euro and Japanese yen currency borrowings
above by amounts equal to £8,590 million and £2,141 million respectively.
At 31 March 2010 the Group had entered into foreign exchange contracts to
decrease its sterling currency borrowings above by £8,257 million and to
increase its euro, US dollar, Japanese yen and other currency borrowings
above by amounts equal to £5,473 million, £1,490 million, £527 million and
£730 million respectively.
Further protection from euro and US dollar interest rate movements is
provided by interest rate swaps. At 31 March 2011 the Group had euro
denominated interest rate swaps covering the period March 2011 to
September 2015 for an amount equal to £883 million and US dollar
denominated interest swaps covering the period March 2011 to September
2015 for an amount equal to £641 million. The average effective rate which
has been fixed is 1.23% for euro denominated interest rate swaps and 1.73%
in relation to US dollar denominated interest rate swaps.
The Group has entered into euro and US dollar denominated interest rate
futures. The euro denominated interest rate futures cover the periods
September 2011 to December 2011, December 2011 to March 2012, March
2012 to June 2012 and June 2012 to September 2012 for amounts equal to
£2,083 million, £833 million, £7,185 million and £6,811 million respectively.
Additional cover is provided for the period March 2013 to March 2014 and
March 2015 to March 2016 for average amounts for each period equal to
£2,006 million and £2,331 million respectively. The US dollar denominated
interest rate futures cover the periods June 2011 to September 2011, June
2013 to September 2013 and September 2013 to December 2013 for
amounts equal to £3,601 million, £1,923 million and £833 million
respectively. The average effective rate which has been fixed is 2.87% for
euro denominated interest rate futures and 1.33% for US dollar denominated
interest rate futures.
The Group has entered into interest rate futures to alter the level of
protection against interest rate movements during some futures periods.
During the period June 2016 to December 2016 euro denominated interest
rate swaps will reduce the level of fixed rate debt in the Group by an amount
equal to £833 million. US dollar denominated futures will reduce the level
of fixed rate debt during the period March 2016 to March 2019 for an amount
equal to £321 million. US dollar denominated interest rate futures will
reduce the level of fixed rate debt during the periods September 2012 to
December 2012 and December 2013 to March 2014 for amounts equal to
£4,487 million and £1,282 million respectively.
At 31 March 2010 the Group had entered into euro and US dollar
denominated interest rate futures. The euro denominated interest rate
futures cover the period June 2010 to September 2010, September 2010 to
December 2010 and December 2010 to March 2011 for amounts equal to
£7,888 million, £8,461 million and £4,067 million respectively. The average
effective rate which has been fixed is 1.27%. The US dollar denominated
interest rate futures cover the period June 2010 to September 2010,
September 2010 to December 2010 and December 2010 to March 2011 for
amounts equal to £3,197 million, £2,582 million, and £1,119 million
respectively. The average effective rate which has been fixed is 0.86%.
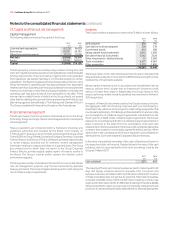
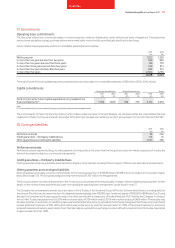
Borrowing facilities
At 31 March 2011 the Group’s most significant committed borrowing
facilities comprised two bank facilities which remained undrawn throughout
the period of €4,150 million (£3,666 million) and US$4,170 million (£2,596
million) both expiring between four and five years (2010: two bank facilities
of US$4,115 million (£2,709 million) and US$5,025 million (£3,308 million)),
a US$650 million (£405 million) bank facility which expires in more than five
years (2010: US$650 million (£428 million)), a ¥259 billion (2010: ¥259
billion (£1,821 million)) term credit facility expired during the period, two
loan facilities of €400 million (£353 million) and €350 million (£309 million)
both expiring between two and five years (2010: two loan facilities of €400
million (£356 million) and €350 million (£312 million) and a loan facility of
€410 million (£362 million) which expires in more than five years (2010:
€410 million (£365 million)). The €400 million and €350 million loan facilities
were fully drawn on 14 February 2007 and 12 August 2008 respectively and
the €410 million facility was drawn on 30 July 2010.
Under the terms and conditions of the €4,150 million and US$4,170 million
bank facilities, lenders have the right, but not the obligation, to cancel their
commitment 30 days from the date of notification of a change of control of
the Company and have outstanding advances repaid on the last day of the
current interest period.
The facility agreements provide for certain structural changes that do not
affect the obligations of the Company to be specifically excluded from the
definition of a change of control. This is in addition to the rights of lenders to
cancel their commitment if the Company has committed an event of default.
The terms and conditions of the €400 million loan facility are similar to those
of the US dollar bank facilities, with the addition that, should the Group’s
Turkish operating company spend less than the equivalent of US$800
million on capital expenditure, the Group will be required to repay the drawn
amount of the facility that exceeds 50% of the capital expenditure.
The terms and conditions of the €350 million loan facility are similar to those
of the US dollar bank facilities, with the addition that, should the Group’s
Italian operating company spend less than the equivalent of €1,500 million
on capital expenditure, the Group will be required to repay the drawn
amount of the facility that exceeds 18% of the capital expenditure.
The terms and conditions of the €410 million loan facility are similar to those
of the US dollar bank facilities, with the addition that, should the Group’s
German fixed line operation, spend less than the equivalent of €824 million
on capital expenditure, the Group will be required to repay the drawn
amount of the facility that exceeds 50% of the capital expenditure.