Vodafone 2011 Annual Report Download - page 52
Download and view the complete annual report
Please find page 52 of the 2011 Vodafone annual report below. You can navigate through the pages in the report by either clicking on the pages listed below, or by using the keyword search tool below to find specific information within the annual report.-
 1
1 -
2
-
3
-
4
-
5
-
6
-
7
-
8
-
9
-
10
-
11
-
12
-
13
-
14
-
15
-
16
-
17
-
18
-
19
-
20
-
21
-
22
-
23
-
24
-
25
-
26
-
27
-
28
-
29
-
30
-
31
-
32
-
33
-
34
-
35
-
36
-
37
-
38
-
39
-
40
-
41
-
 42
42 -
 43
43 -
 44
44 -
 45
45 -
 46
46 -
 47
47 -
 48
48 -
 49
49 -
 50
50 -
 51
51 -
 52
52 -
 53
53 -
 54
54 -
 55
55 -
 56
56 -
 57
57 -
 58
58 -
 59
59 -
 60
60 -
 61
61 -
 62
62 -
63
-
64
-
65
-
66
-
67
-
68
-
69
-
70
-
71
-
72
-
73
-
74
-
75
-
76
-
77
-
78
-
79
-
80
-
81
-
82
-
83
-
84
-
85
-
86
-
87
-
88
-
89
-
90
-
91
-
92
-
93
-
94
-
95
-
96
-
97
-
98
-
99
-
100
-
101
-
102
-
103
-
104
-
105
-
106
-
107
-
108
-
109
-
110
-
111
-
112
-
113
-
114
-
115
-
116
-
117
-
118
-
119
-
120
-
121
-
122
-
123
-
124
-
125
-
126
-
127
-
128
-
129
-
130
-
131
-
132
-
133
-
134
-
135
-
136
-
137
-
138
-
139
-
140
-
141
-
142
-
143
-
144
-
145
-
146
-
147
-
148
-
149
-
150
-
151
-
152
-
153
-
154
-
155
-
156
 |
 |

50 Vodafone Group Plc Annual Report 2011
Financial position and resources continued
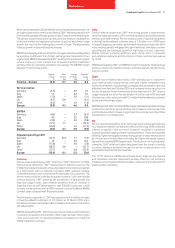
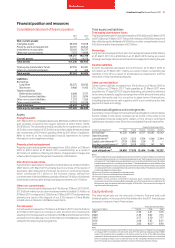
Net debt
Our consolidated net debt position at 31 March was as follows:
2011 2010
£m £m
Cash and cash equivalents(1) 6,252 4,423
Short-term borrowings:
Bonds (2,470) (1,174)
Commercial paper(2) (1,660) (2,563)
Put options over non-controlling interests (3,113) (3,274)
Bank loans (2,070) (3,460)
Other short-term borrowings(1) (593) (692)
(9,906) (11,163)
Long-term borrowings:
Put options over non-controlling interests (78) (131)
Bonds, loans and other long-term borrowings (28,297) (28,501)
(28,375) (28,632)
Other financial instruments(3) 2,171 2,056
Net debt (29,858) (33,316)
Notes:
(1) At 31 March 2011 the amount includes £531 million (2010: £604 million) in relation to cash
received under collateral support agreements.
(2) At 31 March 2011 US$551 million was drawn under the US commercial paper programme and
€1,490 million was drawn under the euro commercial paper programme.
(3) Comprises i) mark-to-market adjustments on derivative financial instruments which are included
as a component of trade and other receivables (2011: £2,045 million; 2010: £2,128 million) and
trade and other payables (2011: £548 million; 2010: £460 million) and ii) short-term investments
in index linked government bonds and collateral support agreements included as a component
of other investments (2011: £674 million; 2010: £388 million). These government bonds have
less than six years to maturity, can be readily converted into cash via the repurchase market and
are held on an effective floating rate basis.
At 31 March 2011 we had £6,252 million of cash and cash equivalents which
are held in accordance with our treasury policy.
We hold cash and liquid investments in accordance with the counterparty
and settlement risk limits of the Board approved treasury policy. The main
forms of liquid investments at 31 March 2011 were money market funds, UK
index linked government bonds and bank deposits.
Net debt decreased by £3,458 million to £29,858 million primarily due to the
sale of our interests in SoftBank and the element of the proceeds from the sale
of our 3.2% interest in China Mobile Limited which was not committed to the
share buyback programme. The £7,049 million free cash flow generated
during the year was primarily used to fund £4,468 million of dividend
payments to shareholders as well as spectrum purchases in Germany and
India. Net debt represented 32.8% of our market capitalisation at 31 March
2011 compared with 41.6% at 31 March 2010. Average net debt at month end
accounting dates over the 12 month period ended 31 March 2011 was
£31.4 billion and ranged between £28.4 billion and £34.9 billion during the year.
The cash received from collateral support agreements mainly reflects the
value of our interest rate swap portfolio which is substantially net present
value positive. See note 21 to the consolidated financial statements for
further details on these agreements.
Commercial paper programmes
We currently have US and euro commercial paper programmes of
US$15 billion and £5 billion respectively which are available to be used to
meet short-term liquidity requirements. At 31 March 2011 an amount
external to the Group of €1,490 million (£1,317 million) was drawn under the
euro commercial paper programme and US$551 million (£343 million) was
drawn down under the US commercial paper programme, with such funds
being provided by counterparties external to the Group. At 31 March 2010
US$245 million (£161 million) was drawn under the US commercial paper
programme and €2,491 million (£2,219 million), £161 million and
US$33 million (£22 million) was drawn under the euro commercial paper
programme. The commercial paper facilities were supported by
US$4.2 billion (£2.6 billion) and €4.2 billion (£3.7 billion) of syndicated
committed bank facilities (see “Committed facilities”), which mature on
9 March 2016 and 1 July 2015 respectively. No amounts had been drawn
under either bank facility.
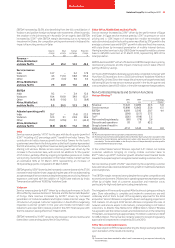
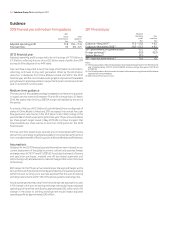
Bonds
We have a €30 billion euro medium-term note programme and a US shelf
programme which are used to meet medium to long-term funding
requirements. At 31 March 2011 the total amounts in issue under these
programmes split by currency were US$14.3 billion, £2.6 billion, €10.6 billion
and £0.2 billion sterling equivalent of other currencies.
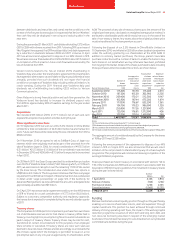
In the year ended 31 March 2011 bonds with a nominal value equivalent of
£0.7 billion at the relevant 31 March 2011 foreign exchange rates were
issued under the US shelf and the euro medium-term note programme. The
bonds issued during the year were:
Nominal Sterling
amount equivalent
Date of bond issue Maturity of bond Million Million
August 2010 August 2011 US$100 64
March 2011 March 2016 US$600 374
March 2011 March 2021 US$500 311
At 31 March 2011 we had bonds outstanding with a nominal value of
£20,987 million (2010: £21,963 million).
Committed facilities
The following table summarises the committed bank facilities available to
us at 31 March 2011.
Committed bank facilities Amounts drawn
1 July 2010
€4.2 billion syndicated
revolving credit facility,
maturing 1 July 2015
No drawings have been made against
this facility. The facility supports our
commercial paper programmes and
may be used for general corporate
purposes including acquisitions.
9 March 2011
US$4.2 billion syndicated
revolving credit facility,
maturing 9 March 2016
No drawings have been made against
this facility. The facility supports our
commercial paper programmes and
may be used for general corporate
purposes including acquisitions.
16 November 2006
€0.4 billion loan facility,
maturing 14 February 2014
This facility was drawn down in full
on 14 February 2007. The facility
is available for financing capital
expenditure in our Turkish
operating company.
28 July 2008
€0.4 billion loan facility,
maturing 12 August 2015
This facility was drawn down in full
on 12 August 2008. The facility is
available for financing the roll-out of
converged fixed mobile broadband
telecommunications network in Italy.
15 September 2009
€0.4 billion loan facility,
maturing 30 July 2017
This facility was drawn down in full
on 30 July 2010. The facility is available
for financing capital expenditure in our
German operations.
29 September 2009
US$0.7 billion export
credit agency loan facility,
final maturity date
19 September 2018
An initial drawing was made of
US$120 million on 3 November 2010.
The facility is available for financing
eligible Swedish goods and services.