Vodafone 2011 Annual Report Download - page 93
Download and view the complete annual report
Please find page 93 of the 2011 Vodafone annual report below. You can navigate through the pages in the report by either clicking on the pages listed below, or by using the keyword search tool below to find specific information within the annual report.-
 1
1 -
2
-
3
-
4
-
5
-
6
-
7
-
8
-
9
-
10
-
11
-
12
-
13
-
14
-
15
-
16
-
17
-
18
-
19
-
20
-
21
-
22
-
23
-
24
-
25
-
26
-
27
-
28
-
29
-
30
-
31
-
32
-
33
-
34
-
35
-
36
-
37
-
38
-
39
-
40
-
41
-
42
-
43
-
44
-
45
-
46
-
47
-
48
-
49
-
50
-
51
-
52
-
53
-
54
-
55
-
56
-
57
-
58
-
59
-
60
-
61
-
62
-
63
-
64
-
65
-
66
-
67
-
68
-
69
-
70
-
71
-
72
-
73
-
74
-
75
-
76
-
77
-
78
-
79
-
80
-
81
-
82
-
 83
83 -
 84
84 -
 85
85 -
 86
86 -
 87
87 -
 88
88 -
 89
89 -
 90
90 -
 91
91 -
 92
92 -
 93
93 -
 94
94 -
 95
95 -
 96
96 -
 97
97 -
 98
98 -
 99
99 -
 100
100 -
 101
101 -
 102
102 -
 103
103 -
104
-
105
-
106
-
107
-
108
-
109
-
110
-
111
-
112
-
113
-
114
-
115
-
116
-
117
-
118
-
119
-
120
-
121
-
122
-
123
-
124
-
125
-
126
-
127
-
128
-
129
-
130
-
131
-
132
-
133
-
134
-
135
-
136
-
137
-
138
-
139
-
140
-
141
-
142
-
143
-
144
-
145
-
146
-
147
-
148
-
149
-
150
-
151
-
152
-
153
-
154
-
155
-
156
 |
 |
Vodafone Group Plc Annual Report 2011 91
Financials
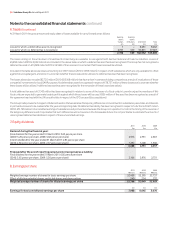
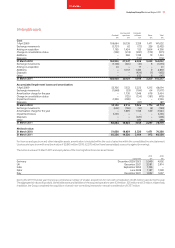
A reconciliation of EBITDA to operating profit is shown below. For a reconciliation of operating profit to profit before taxation, see the consolidated income
statement on page 80.
2011 2010 2009
£m £m £m
EBITDA 14,670 14,735 14,490
Depreciation, amortisation and loss on disposal of fixed assets (7,967) (8,011) (6,824)
Share of results in associates 5,059 4,742 4,091
Impairment losses (6,150) (2,100) (5,900)
Other income and expense (16) 114 –
Operating profit 5,596 9,480 5,857
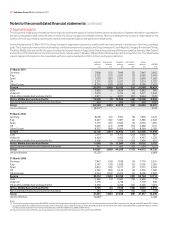
Other
expenditure
on Depreciation Impairment
Non-current Capital intangible and (reversal)/
assets (1) expenditure(2) assets amortisation loss
£m £m £m £m £m
31 March 2011
Germany 20,764 824 1,214 1,361 –
Italy 16,645 590 12 732 1,050
Spain 9,596 517 – 641 2,950
UK 6,665 516 – 874 –
Other Europe 11,438 1,230 59 1,406 2,150
Europe 65,108 3,677 1,285 5,014 6,150
India 9,882 870 1,851 973 –
Vodacom 7,382 572 19 1,013 –
Other Africa, Middle East and Asia Pacific 4,797 754 2 793 –
Africa, Middle East and Asia Pacific 22,061 2,196 1,872 2,779 –
Non-Controlled Interests and Common Functions 1,570 346 9 83 –
Group 88,739 6,219 3,166 7,876 6,150
31 March 2010
Germany 20,211 766 18 1,422 –
Italy 17,941 610 60 732 –
Spain 12,746 543 – 638 –
UK 6,977 494 – 963 –
Other Europe 13,883 1,282 228 1,467 (200)
Europe 71,758 3,695 306 5,222 (200)
India 8,665 853 – 848 2,300
Vodacom 7,783 520 – 1,005 –
Other Africa, Middle East and Asia Pacific 5,062 694 – 683 –
Africa, Middle East and Asia Pacific 21,510 2,067 – 2,536 2,300
Non-Controlled Interests and Common Functions 1,632 430 19 152 –
Group 94,900 6,192 325 7,910 2,100
31 March 2009
Germany 750 16 1,378 –
Italy 521 – 735 –
Spain 632 – 606 3,400
UK 446 – 1,010 –
Other Europe 1,013 21 1,441 2,250
Europe 3,362 37 5,170 5,650
India 1,351 – 746 –
Vodacom 237 – 231 –
Other Africa, Middle East and Asia Pacific 581 1,101 527 250
Africa, Middle East and Asia Pacific 2,169 1,101 1,504 250
Non-Controlled Interests and Common Functions 378 – 140 –
Group 5,909 1,138 6,814 5,900
Notes:
(1) Comprises goodwill, other intangible assets and property, plant and equipment.
(2) Includes additions to property, plant and equipment and computer software, reported within intangible assets.